Fundamental vs Technical Analysis: A Guide for 2026 Investors
Learn how to differentiate between fundamental and technical analysis to evaluate Nifty 50 and Sensex stocks in the evolving 2026 market landscape.
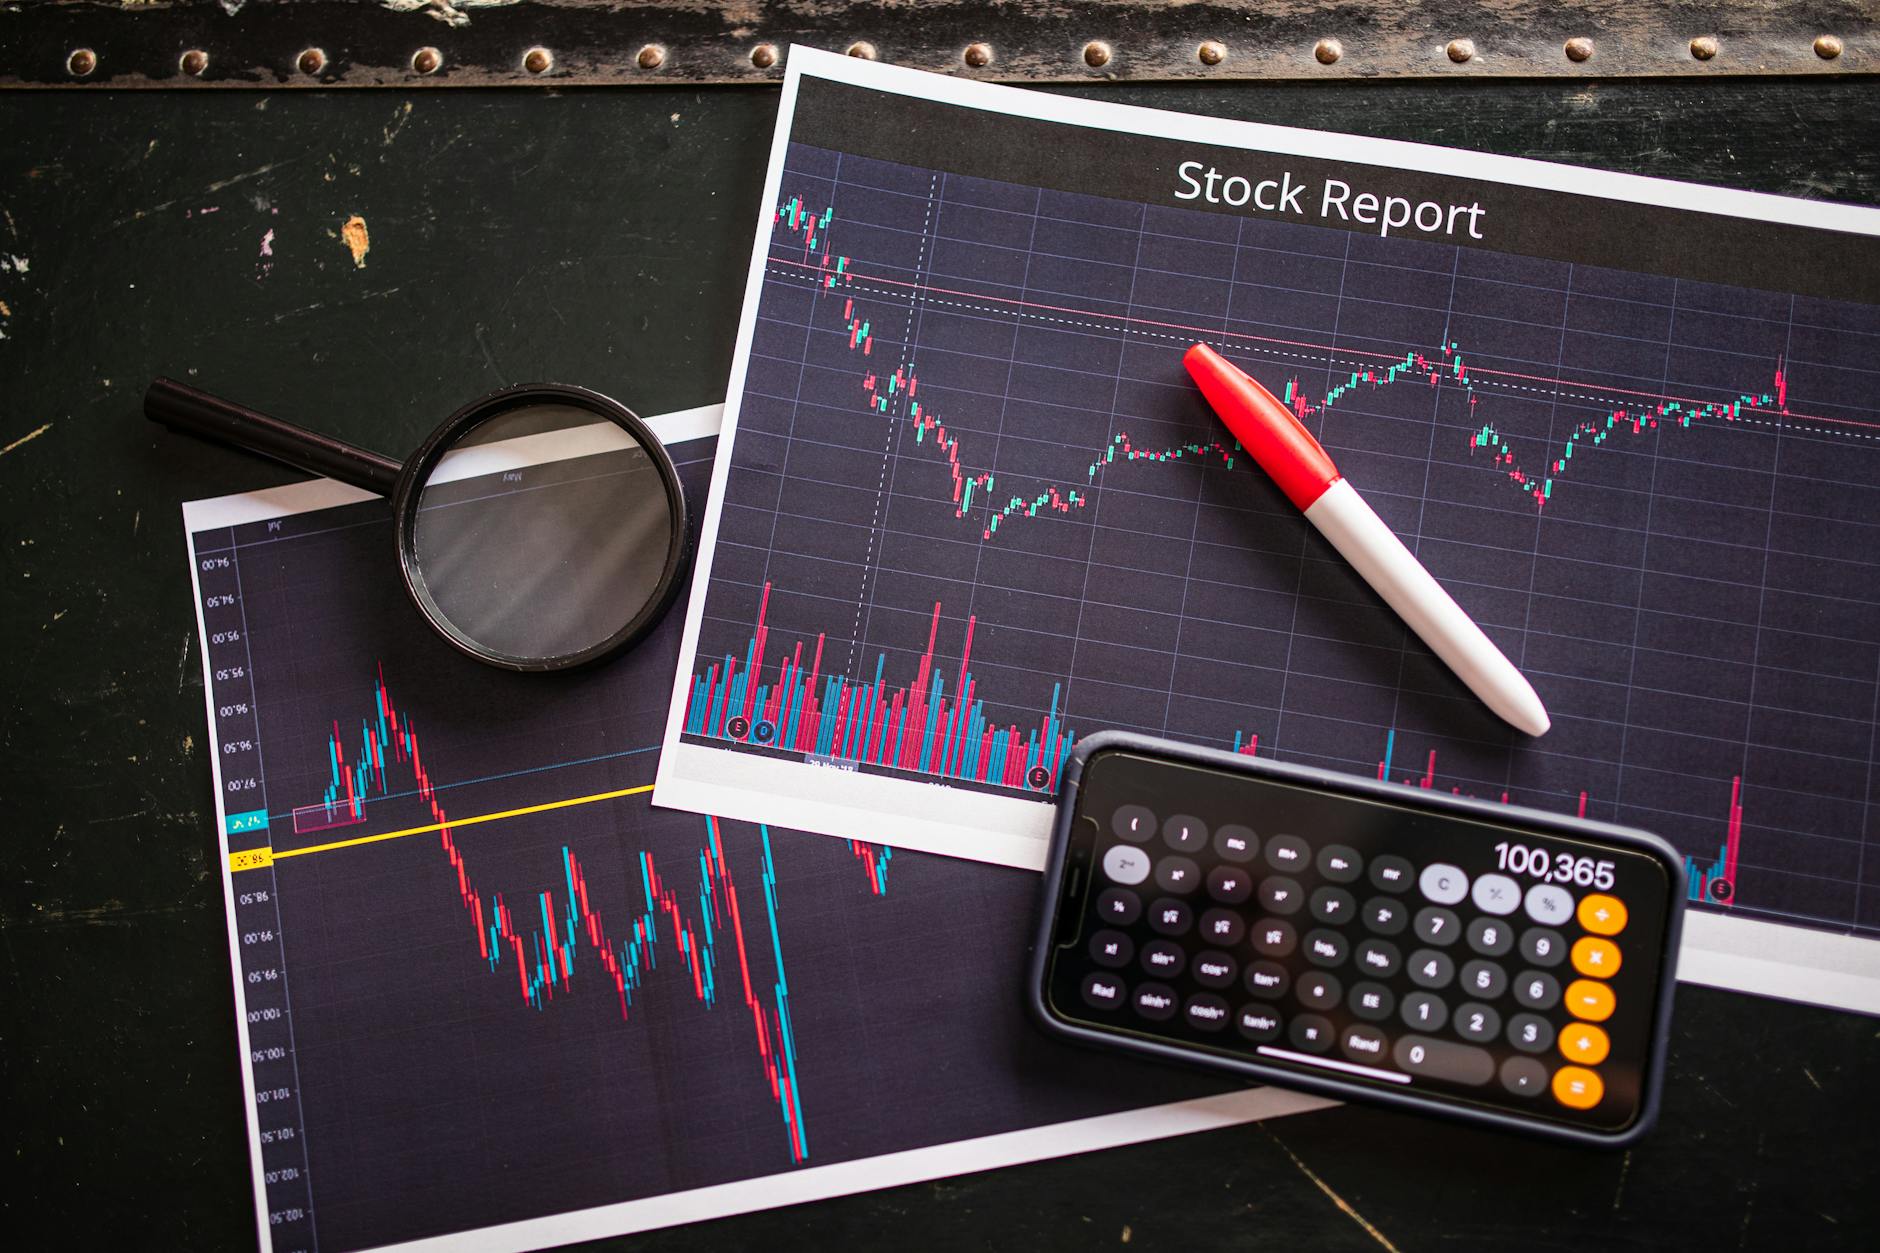
Navigating the volatile waters of the Indian stock market requires more than just intuition or a "gut feeling." As we move through 2026, the markets—driven by the Nifty 50 and Sensex—have become increasingly sophisticated, influenced by global macro trends and rapid digital transformation. Whether you are looking at a large-cap blue-chip company listed on the NSE or a high-growth mid-cap on the BSE, the fundamental question remains the same: How do you decide which stock deserves a place in your portfolio?
To answer this, investors generally rely on two distinct but complementary methodologies: Fundamental Analysis and Technical Analysis. Understanding the nuances of both is the difference between gambling and disciplined investing.
Understanding Fundamental Analysis: The "Why" Behind the Value
Fundamental analysis is the art of determining a security's intrinsic value. If you were buying a physical shop in a busy Mumbai market, you wouldn't just look at the sign on the door; you would check the footfall, the rent, the health of the local economy, and the profitability of the shop. Fundamental analysis is that same process, applied to a company.
The goal is to understand whether a stock is undervalued, fairly valued, or overvalued by comparing its current market price to its actual worth.
The Qualitative Side: The Business Moat
Before touching a spreadsheet, an investor must evaluate the "story" of the company. This involves looking at:
- Business Model: How does the company actually make money? Is the product a necessity or a luxury?
- Competitive Advantage (The Moat): Does the company have a brand, a patent, or a cost advantage that protects it from competitors? For example, a dominant player in the Indian FMCG sector might have a "moat" through an massive distribution network that smaller players cannot replicate.
- Management Quality: This is critical in the Indian context. You want to look for promoters with a clean track record, transparency in disclosures, and a history of efficient capital allocation.
The Quantitative Side: The Numbers that Matter
Once you understand the business, you dive into the financial statements. You can use tools like the Downstox Screener to filter companies based on these key metrics:
- Earnings Per Share (EPS): This tells you how much profit is allocated to each outstanding share.
- Price-to-Earnings (P/E) Ratio: This compares the stock price to its EPS. While a high P/E might suggest a stock is overvalued, it could also mean investors expect high growth in the future.
- Debt-to-Equity Ratio: In a high-interest-rate environment, companies with heavy debt can struggle. Investors often look for companies with manageable debt levels.
- Return on Equity (ROE) and Return on Capital Employed (ROCE): These metrics indicate how efficiently a company uses its shareholders' capital to generate profits.
Practical Example: Imagine you are evaluating a major Indian banking stock. A fundamental analyst wouldn't just look at the stock price movement. They would scrutinize the Non-Performing Assets (NPAs), the Net Interest Margin (NIM), and the Capital Adequacy Ratio to ensure the bank is healthy enough to weather economic shifts.
Understanding Technical Analysis: The "When" of the Trade
While fundamental analysis looks at the "what" and "why," technical analysis focuses on the "when." Technical analysts believe that all known information about a company is already reflected in its stock price. Therefore, they don't study the company's balance sheet; they study price action and volume.
Technical analysis is primarily used by traders—those looking to profit from short-term price fluctuations in the Nifty or individual stocks.
Key Tools of the Technical Analyst
To read the "language" of the charts, traders use several indicators and patterns:
- Candlestick Charts: These provide a visual representation of the open, high, low, and close prices for a specific period. They help identify market sentiment.
- Moving Averages (MA): By smoothing out price data, moving averages help identify the direction of a trend. For instance, a "Golden Cross" (when a short-term moving average crosses above a long-term one) is often viewed as a bullish signal.
- Relative Strength Index (RSI): This is a momentum oscillator that measures the speed and change of price movements. An RSI above 70 might suggest a stock is "overbought," while an RSI below 30 might suggest it is "oversold."
- Volume: Volume is the fuel of price movement. If a stock price jumps significantly on high trading volume, it suggests strong conviction behind the move.
The Concept of Support and Resistance
In any market, prices tend to bounce off certain levels.
- Support: A price level where a downtrend tends to pause due to a concentration of buying interest.
- Resistance: A price level where an uptrend tends to pause because selling pressure increases.
Practical Example: Suppose a stock has been trading between ₹500 and ₹550 for several months. A trader might see the ₹500 level as "support." If the stock price approaches ₹500 and the RSI indicates it is oversold, a trader might look for a long position, expecting the price to bounce back upward.
Fundamental vs. Technical: Which One Should You Use?
A common debate among investors is whether one method is superior to the other. The truth is that they serve different purposes and different types of market participants.
| Feature | Fundamental Analysis | Technical Analysis |
|---|---|---|
| Primary Goal | To find "Value" (Intrinsic worth) | To find "Timing" (Price direction) |
| Time Horizon | Long-term (Years) | Short-term (Days, Weeks, Months) |
| Data Source | Financial statements, Economic data | Price charts, Volume, Indicators |
| Best For | Investors building wealth | Traders capturing volatility |
The Hybrid Approach: The Best of Both Worlds
Many successful market participants do not choose one; they use both. This is often called "Techno-Fundamental" analysis.
Here is how an investor might combine them:
- Use Fundamental Analysis to select the "Universe": Use a screener to find companies with high ROE, low debt, and consistent profit growth. This ensures you are only looking at "quality" companies.
- Use Technical Analysis to find the "Entry": Once you have your list of high-quality stocks, don't just buy them immediately. Look at the charts. Wait for a breakout from a resistance level or a bounce off a support level to ensure you aren't "catching a falling knife."
By combining these, you avoid the trap of buying a great company at a terrible price (Fundamental mistake) or buying a cheap-looking stock that is in a permanent downward spiral (Technical mistake).
Risk Management: The Silent Pillar of Success
Regardless of whether you are analyzing the Sensex or a US-listed tech giant via a GIFT City route, the most important part of any strategy is risk management. Even the most brilliant fundamental analysis can be wrong if an unforeseen global event occurs.
Diversification: The Only "Free Lunch"
In 2026, market volatility can be triggered by geopolitical shifts, interest rate changes by the RBI, or global supply chain disruptions. To protect your capital:
- Sector Diversification: Don't put all your money in IT or all in Banking.
- Market Cap Diversification: Balance your portfolio with Large-cap stability and Mid-cap growth potential.
- Asset Diversification: Consider a mix of equities, gold, and debt.
Using Technology to Monitor Risk
Modern investors have access to powerful tools to keep their portfolios in check.
- Portfolio X-Ray: Use tools like Downstox's Portfolio X-Ray to see your hidden exposures. Are you unintentionally over-exposed to a single sector?
- Mutual Fund Screeners: If you prefer a hands-off approach, use a mutual fund screener to see how fund managers are allocating capital and whether their strategy aligns with your risk appetite.
- Real-time Terminals: For active traders, a professional-grade terminal provides the speed and data depth required to react to sudden market shifts.
How to Start Your Journey
If you are new to this, do not feel overwhelmed. You don't need to be a mathematician to be a successful investor. Start with these steps:
- Start Small and Educate: Begin by observing the market. Pick a company you use every day (like a major paint company or a leading bank) and try to find its P/E ratio and recent price trend.
- Use Paper Trading: Before committing real capital to technical strategies, practice your chart patterns with "virtual money."
- Focus on Consistency over Intensity: It is better to make small, informed decisions consistently than to make one "big bet" based on a tip.
- Leverage Digital Tools: Use screeners to filter out the noise. Instead of looking at 5,000 listed stocks, use filters to narrow them down to the 20 that meet your specific financial criteria.
The markets in 2026 offer unprecedented opportunities, but they also demand unprecedented discipline. Whether you are analyzing the long-term trajectory of the Indian economy or the short-term volatility of a Nasdaq-listed stock, remember that knowledge is your greatest asset.
This article is for information and education only. Downstox is not a SEBI-registered Research Analyst or Investment Adviser and this is not investment advice. Markets carry risk; consult a SEBI-registered adviser before investing.
For information and education only. This article is for information and education only. Downstox is not a SEBI-registered Research Analyst or Investment Adviser, and nothing here is investment advice or a recommendation to buy or sell any security. Any views or calls attributed to third parties are theirs, not Downstox's. Markets carry risk; consult a SEBI-registered adviser before investing.
Downstox Macro Desk
Macro & Policy Desk · RBI monetary policy · Indian fiscal policy · GST
RBI, Centre policy, FX, FII flows, global macro spillover into Indian markets.
View Downstox Macro Desk's profile →Get weekly market insights delivered free
Curated Indian market analysis, every Sunday morning. Written by traders, for traders.
Join 10,000+ Indian traders. No spam. Unsubscribe anytime.
Related reads
More in beginner guide →
How to Start Investing in Indian Stock Market: A Complete Beginner Guide

Top Free Trading Tools for Indian Retail Investors 2026
Navigating India’s Stock Market: Nifty, Sensex & Downstox Guide

Free Trading Tools for Indian Retail Investors 2026 Guide
