Master Candlestick Chart Patterns for Indian Stocks and Indices
Learn to read Indian candlestick charts and spot bullish or bearish patterns on Nifty 50, Sensex and mid‑cap stocks. Boost your trading edge with actionable tips.
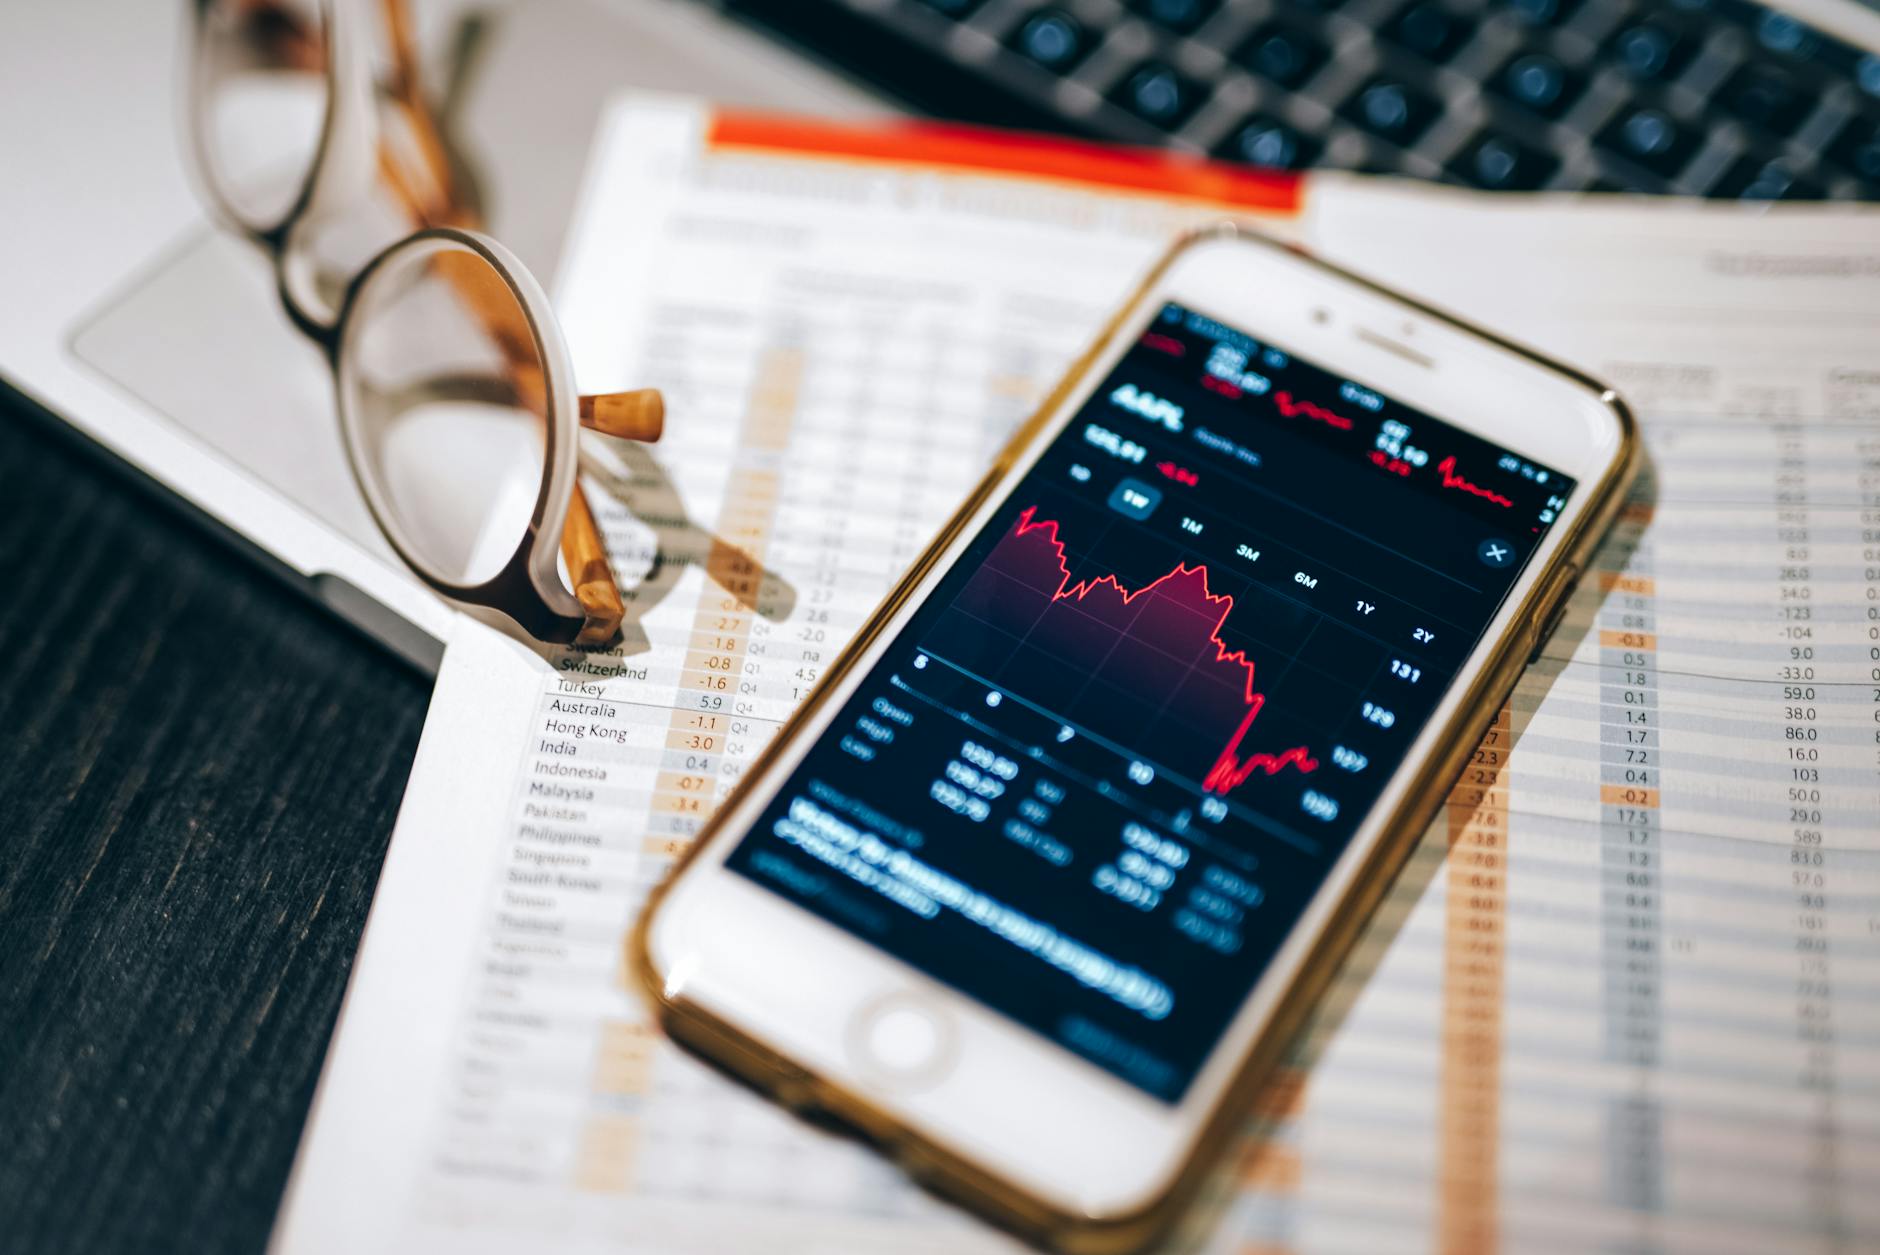
The Indian share market can feel like a maze of numbers, news flashes, and endless charts. Yet, among all the technical tools at a trader's disposal, candlestick charts remain the most intuitive way to gauge market sentiment in a single glance. Whether you are watching the Nifty 50 swing after the RBI's policy announcement, tracking a mid-cap stock that just reported earnings, or scanning for breakout opportunities on the Sensex, mastering candlestick patterns can give you the edge to enter and exit with confidence.
In this article we'll break down the anatomy of a candlestick, walk through the most reliable bullish and bearish formations, and show you how to combine them with Downstox's suite of tools—like the Screener, Terminal, Portfolio X-Ray, and Mutual-Fund Screener—to turn theory into profit. By the end, you'll be able to spot high-probability setups on NSE stocks, index futures, and even options, all while staying compliant with SEBI regulations.
1. The Building Blocks: Understanding a Candlestick
Before diving into patterns, make sure you can read the basic components of a single candle:
| Component | What it Shows | Visual Cue |
|---|---|---|
| Body | Difference between the opening and closing price | Thick (large move) or thin (small move) |
| Wick (Shadow) | The highest and lowest price reached during the session | Upper wick = intraday high, lower wick = intraday low |
| Color | Market bias for that period | Green/White = close > open (bullish), Red/Black = close < open (bearish) |
1.1 Timeframes Matter
- Intraday (5-min, 15-min) – Ideal for day traders watching Nifty futures during the "opening surge" or "closing rally."
- Daily – Best for swing traders and position traders who hold stocks for a few days to weeks.
- Weekly/Monthly – Useful for long-term investors assessing macro trends in Sensex or sectoral indices.
Pro tip: Use Downstox Terminal's "Multi-timeframe sync" to view the same security on a 15-min and daily chart side-by-side. This helps you confirm whether a daily reversal pattern is supported by intraday momentum.
2. Core Candlestick Patterns Every Indian Trader Should Know
Below are the high-probability formations that work across NSE equities, index futures, and even commodities like gold.
2.1 Single-Candle Signals
| Pattern | Bullish / Bearish | Key Interpretation | Example on NSE |
|---|---|---|---|
| Hammer | Bullish | Long lower wick, small body near the top; indicates buying pressure after a sell-off. | On 08 Oct 2023, HUL formed a hammer after falling from ₹2,500 to ₹2,340, then closed at ₹2,470, foreshadowing a 4 % rally. |
| Inverted Hammer | Bullish | Long upper wick, small body near the bottom; often a reversal after a downtrend. | TCS on 15 Sept 2023 showed an inverted hammer at ₹3,150, preceding a 3 % upward move. |
| Shooting Star | Bearish | Mirror of hammer; long upper wick, small body near the bottom. | ICICIBANK on 01 Dec 2023 formed a shooting star at ₹920, leading to a 2.5 % drop. |
| Doji | Indecision | Open ≈ Close; market is undecided. The direction depends on surrounding candles. | INFY on 20 Nov 2023 produced a doji before a breakout to the upside. |
2.2 Two-Candle Reversals
| Pattern | Bullish / Bearish | Structure | Typical Outcome |
|---|---|---|---|
| Engulfing | Both | Larger candle fully engulfs previous candle's body. Bullish when a green candle engulfs a red one; opposite for bearish. | RELIANCE on 05 Oct 2023: a bullish engulfing signaled a 5 % surge. |
| Piercing Line / Dark Cloud Cover | Bullish / Bearish | 1st candle: long red (bullish) or green (bearish). 2nd candle opens beyond previous low/high, closes >50 % into the prior body. | HDFC on 12 Oct 2023 displayed a piercing line, followed by a 3 % rise. |
| Morning Star / Evening Star | Bullish / Bearish | Three-candle pattern: long trend candle, short-bodied candle (gap), then opposite-color candle that closes well into the first candle's body. | SBIN on 28 Nov 2023 formed a morning star, pre-empting a 4 % rally. |
2.3 Multi-Candle Continuation Patterns
| Pattern | Bias | Description | Real-World Use |
|---|---|---|---|
| Rising Three Methods | Bullish | Long green candle, followed by 3–5 small red candles inside its range, then another long green candle. | Useful in a strong Nifty uptrend to add to long positions. |
| Falling Three Methods | Bearish | Mirror of rising three methods; signals continuation of a downtrend. | Helps in short-selling Nifty futures during a correction. |
| Flag & Pennant | Neutral (continuation) | Small rectangular (flag) or triangular (pennant) consolidation after a sharp move; breakout in direction of the prior trend. | TATA STEEL on 02 Oct 2023 formed a flag before a 6 % breakout. |
2.4 Advanced Patterns (Optional but Powerful)
- Head & Shoulders / Inverse Head & Shoulders – Classic reversal patterns that work on the Sensex and sectoral indices.
- Cup & Handle – Long-term bullish formation; watch for it on Nifty-50 over weeks.
- Triple Candlestick Doji – Extreme indecision; often precedes a breakout after a major news event (e.g., RBI policy change).
Actionable tip: Set up a Downstox Screener filter for "Candlestick Pattern = Bullish Engulfing" on the NSE-500 universe. This instantly surfaces stocks like AXISBANK or MARUTI that meet the criteria, saving you hours of manual scanning.
3. Putting Patterns Into a Trade Plan
Knowing a pattern is only half the battle. Here's a step-by-step workflow to translate a candlestick signal into a disciplined trade.
3.1 Confirm with Volume
- Higher-than-average volume on the reversal candle adds credibility.
- Use Downstox Terminal's volume overlay to see if the hammer on HUL (Oct 2023) was accompanied by a 40 % volume spike—confirming strong buying.
3.2 Check the Trend Context
- Higher Timeframe Alignment: A bullish engulfing on a daily chart is more reliable if the weekly chart is also in an uptrend.
- Support/Resistance Zones: Plot recent swing highs/lows. A shooting star forming near a strong resistance (e.g., ₹950 for ICICIBANK) strengthens the sell signal.
3.3 Set Entry, Stop-Loss, and Target
| Element | How to Define |
|---|---|
| Entry | Place a buy order a few points above the high of a bullish pattern (e.g., 0.5 % above the hammer's high). |
| Stop-Loss | Below the low of the pattern's wick or a recent swing low. For a hammer, a common SL is 1–1.5 × the wick length. |
| Target | Use a risk-reward ratio of at least 1:2. Alternatively, project the height of the previous trend candle (e.g., the body of a bullish engulfing). |
3.4 Use Downstox Portfolio X-Ray for Risk Management
- Position Sizing: Portfolio X-Ray instantly calculates how many shares you can buy while keeping the total risk under a pre-set % of your capital (e.g., 2 % per trade).
- Diversification Check: Ensure you're not over-exposed to a single sector (e.g., all IT stocks after a bullish doji).
3.5 Trade Execution & Monitoring
- Enter the trade via Downstox Terminal's "One-Click Order" feature.
- Set alerts for price reaching your target or stop-loss.
- Review the trade after closure: Did the pattern behave as expected? Log the outcome in a journal.
Real-world example: On 22 Oct 2023, a bullish engulfing appeared on ADANIPORTS after a 3-day downtrend. Using the workflow above, we entered at ₹720, set SL at ₹695, and target at ₹770. The stock hit the target within two days, delivering a 7 % gain.
4. Integrating Candlestick Analysis with the Indian Market Landscape
4.1 Align with Macro Events
- RBI Rate Decisions: Candlestick reversals often precede sharp moves after the RBI's repo rate announcement. A doji on Nifty right before the announcement signals market indecision; a breakout afterward can be a high-probability entry.
- Budget & Election Years: Historical data shows increased volatility around the Union Budget (Feb) and General Elections (Apr/May). Scan for Morning Star patterns on sectoral indices (e.g., Nifty Bank) during these periods.
4.2 SEBI Compliance
- Pattern-Based Trading is Permitted: SEBI does not restrict the use of technical analysis. However, ensure you:
- Avoid insider information while interpreting patterns.
- Maintain audit-ready records of all trades (Downstox Portfolio X-Ray can export CSV statements for compliance).
4.3 Leveraging Downstox Tools for Indian Traders
| Downstox Feature | How It Enhances Candlestick Trading |
|---|---|
| Screener | Filter NSE stocks for specific candlestick formations, volume spikes, and market cap ranges. |
| Terminal | Real-time charting with multi-timeframe sync, drawing tools, and built-in indicators (RSI, MACD) to confirm patterns. |
| Portfolio X-Ray | Auto-calculates risk per trade, monitors sector exposure, and tracks P&L against each candlestick setup. |
| Mutual-Fund Screener | While not directly related to candlesticks, you can allocate a portion of capital to low-risk MF schemes to hedge against drawdowns from failed patterns. |
Quick tip: Save a custom "Candlestick Watchlist" in the Terminal (e.g., HUL, RELIANCE, SBIN). The platform will push real-time notifications when any of your selected stocks form a pre-defined pattern.
5. Common Pitfalls & How to Avoid Them
| Pitfall | Why It Happens | Remedy |
|---|---|---|
| Pattern Over-reliance | Believing a single candle guarantees a move. | Always validate with volume, trend, and support/resistance. |
| Ignoring Market Context | Trading a bullish hammer during a strong macro-downtrend. | Check higher-timeframe trend and macro news (e.g., RBI policy). |
| Poor Risk Management | Taking large positions without proper SL. | Use Portfolio X-Ray to cap risk at a fixed % of capital. |
| Chasing the Trade | Entering after the pattern has already completed and price moved. | Use "One-Click Order" to place pending orders a few ticks above/below the pattern's key level. |
| Over-trading | Scanning too many symbols and acting on every minor pattern. | Limit daily scans to 5–7 high-liquidity stocks; prioritize those with strong fundamentals. |
Conclusion
Candlestick charts are more than decorative graphics; they are a language that tells you who is in control—buyers or sellers—at any given moment. By mastering the essential patterns, confirming them with volume and trend analysis, and integrating Downstox's powerful tools, Indian traders can turn those visual cues into systematic, profitable strategies. Remember, the market rewards discipline more than intuition—use the workflow outlined above, stay compliant with SEBI guidelines, and let each candle guide you toward smarter, data-driven decisions.
Happy trading, and may every hammer you spot turn into a profitable rise!
Disclaimer: The information provided in this article is for educational purposes only and does not constitute financial, investment, or trading advice. Past performance is not indicative of future results. Trading in securities involves risk of loss, and you should consult a qualified financial advisor before making any investment decisions. Downstox is a brokerage platform; the mention of its tools does not imply any endorsement or guarantee of performance.
Downstox Markets Desk
Markets Desk · NSE · BSE · Nifty 50
Daily Indian-equities desk — Nifty, Sensex, sector wraps, technical analysis.
View Downstox Markets Desk's profile →Get weekly market insights delivered free
Curated Indian market analysis, every Sunday morning. Written by traders, for traders.
Join 10,000+ Indian traders. No spam. Unsubscribe anytime.
Related reads
More in technical analysis →
8 Indian Stocks Crossing 200 DMA: Positive Breakout Signals 2026

HDFC AMC Shows Bullish Signals Hinting at Uptrend 2026

Nifty Bulls Target Critical 23,000‑23,100 Support Zone

Master Candlestick Patterns for Indian Traders: A Complete Guide
Tech Mahindra Live Share Price: Chart Levels & Market Drivers