Master Candlestick Patterns for Indian Traders: A Complete Guide
Learn how to read candlestick charts on the Nifty 50 and Sensex, master key patterns, and boost entry, exit and risk management for day‑traders and long‑term investors.

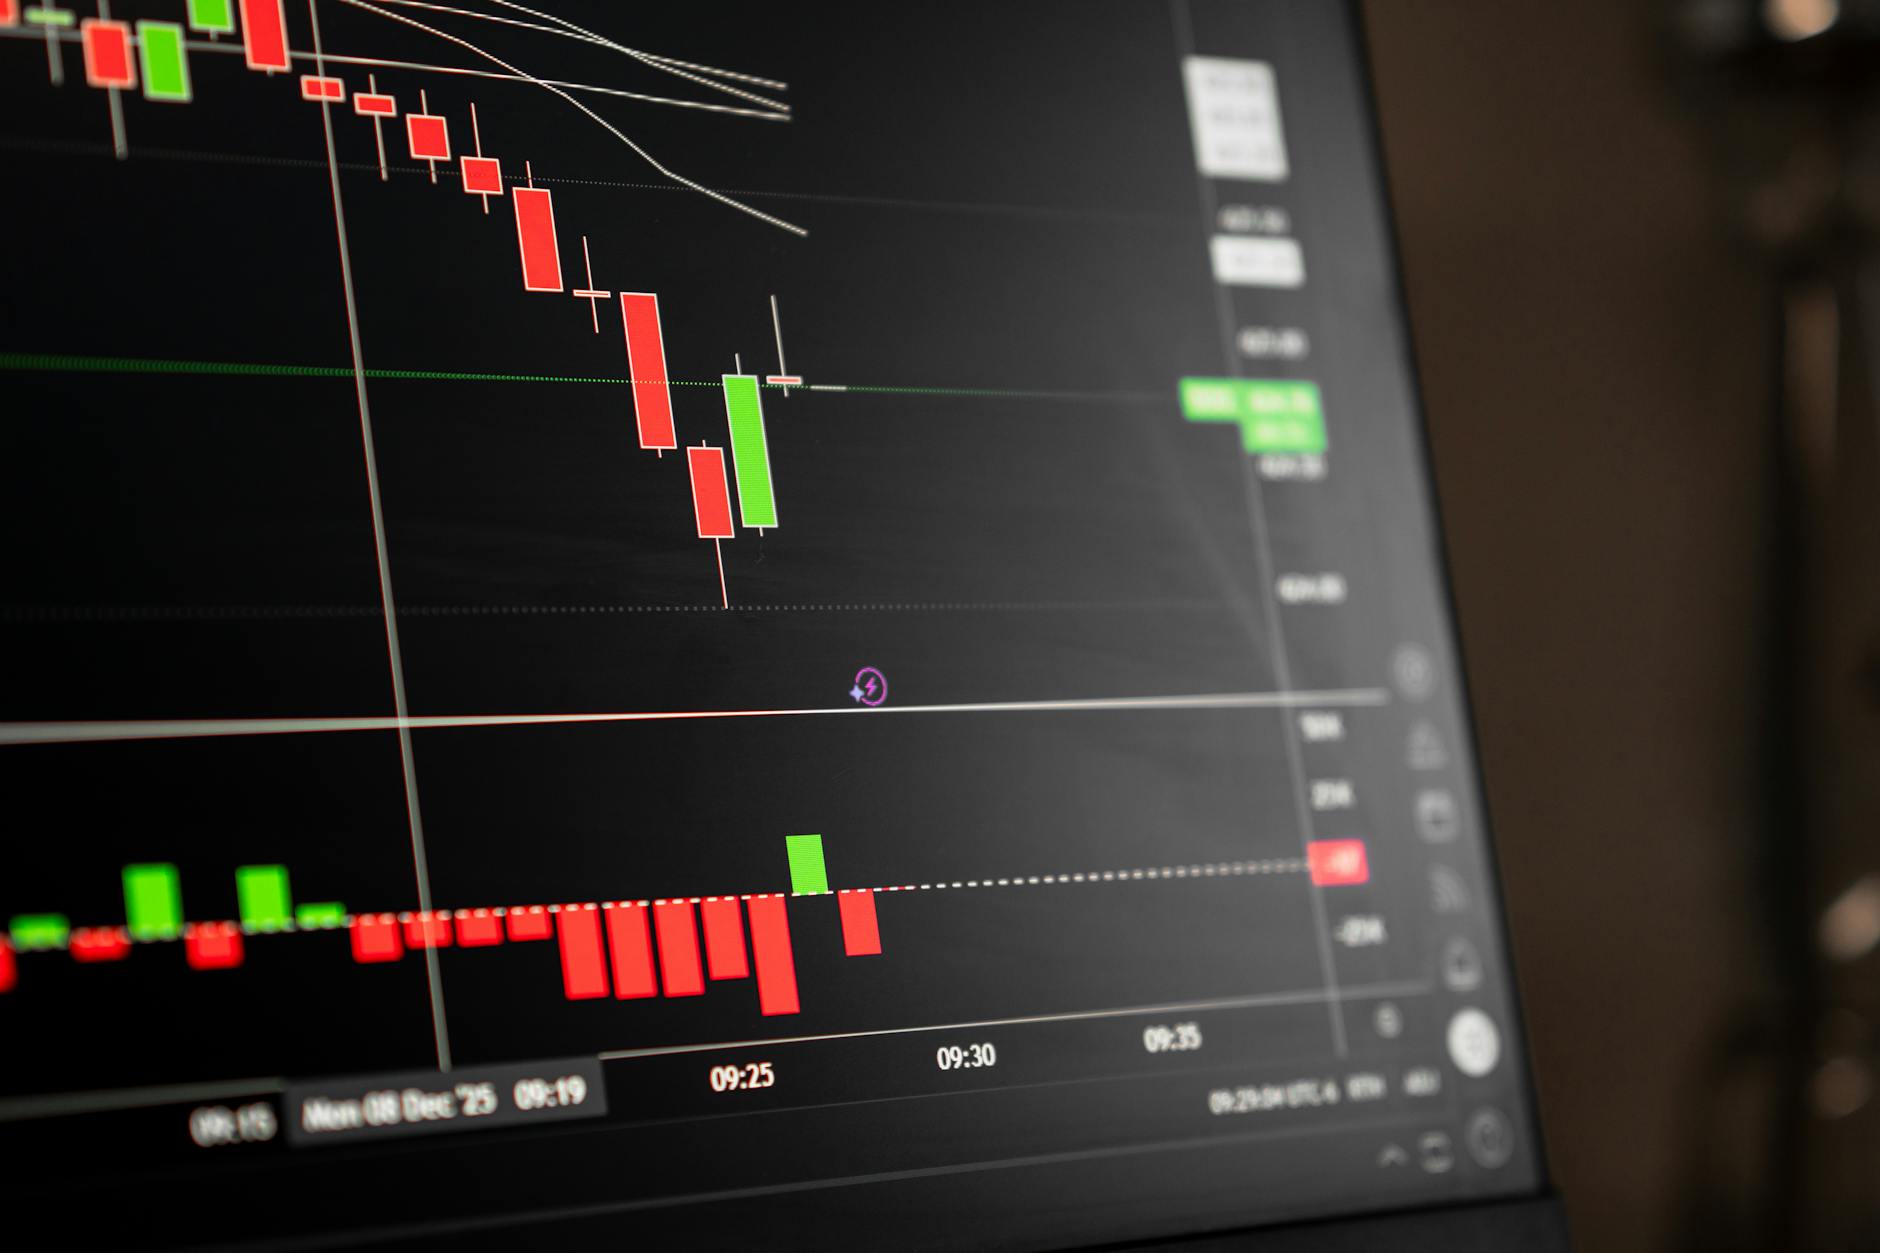
Candlestick charts have become the lingua franca of modern trading, especially for Indian investors who watch the Nifty 50 and Sensex tick by tick on their screens. Unlike line charts that only show closing prices, candlesticks pack four pieces of information – open, high, low, and close – into a single visual unit. This richness lets traders spot shifts in market sentiment before they fully materialize in price action. Whether you are a day-trader scalping intraday moves on NSE-listed stocks or a long-term investor building a portfolio around blue-chip names, mastering candlestick patterns can sharpen your entry and exit decisions, improve risk management, and help you avoid false breakouts.
In this guide we'll walk through the essential building blocks of candlestick analysis, highlight the most reliable patterns that every trader should know, and show how to apply them in the Indian market context using practical examples and Downstox tools that streamline the process. By the end, you'll have a repeatable framework to read charts, validate signals with volume and support/resistance, and execute trades with greater confidence.
Understanding Candlestick Basics
Before diving into patterns, it's useful to grasp what a candlestick actually tells you.
Anatomy of a Candle
- Real body – the thick part between the open and close. A bullish candle (usually green or white) has a close higher than the open; a bearish candle (red or black) closes lower.
- Upper shadow (wick) – the line above the real body showing the period's high.
- Lower shadow (wick) – the line below the real body showing the period's low.
- Length of the body – indicates the strength of the move; a long body suggests strong buying or selling pressure, while a short body reflects indecision.
- Length of the shadows – long shadows hint at rejection of extreme prices; short shadows imply the price stayed near the open/close.
Timeframes Matter
In the Indian equity market, traders commonly use:
- Intraday – 5-minute, 15-minute, or 30-minute charts for scalping and day trading.
- Swing – 1-hour, 4-hour, or daily charts for positions held a few days to weeks.
- Investment – weekly or monthly charts for long-term trend assessment.
Choosing the right timeframe aligns the pattern's signal with your trading horizon. A bullish engulfing on a 5-minute chart may trigger a quick scalp, whereas the same pattern on a daily chart could signal the start of a multi-week uptrend.
Why Candlesticks Work in India
Indian markets exhibit strong retail participation, especially around earnings seasons, budget announcements, and RBI policy days. Candlestick patterns capture the collective psychology of this diverse trader base – from institutional algo traders to retail investors using apps like Downstox. Moreover, SEBI's emphasis on transparency means price data is reliable, making pattern-based analysis a viable edge when combined with volume and fundamentals.
Single Candlestick Patterns – The First Clues
Single-candle patterns are the simplest signals, often indicating a pause or reversal in the prevailing trend. They are most effective when they appear at key support/resistance levels or after an extended move.
1. Doji
- Appearance: Open and close are virtually equal, resulting in a tiny real body with long upper and/or lower shadows.
- Interpretation: Market indecision; buyers and sellers are in equilibrium.
- Trading cue: A Doji after a strong uptrend can warn of weakening momentum; after a downtrend it may hint at a potential bounce. Confirm with the next candle's direction.
- Indian example: On 12 Mar 2024, Reliance Industries formed a Doji on the daily chart near ₹2,450 after a rally from ₹2,200. The following day's bearish engulfing confirmed a short-term pullback to ₹2,380.
2. Hammer & Inverted Hammer
- Hammer: Small real body at the upper end of the range, long lower shadow (at least twice the body length), little or no upper shadow.
- Inverted Hammer: Small real body at the lower end, long upper shadow, little or no lower shadow.
- Interpretation: Both suggest a potential reversal – hammer after a downtrend, inverted hammer after an uptrend (though the latter is weaker).
- Trading cue: Look for a bullish confirmation candle (close above the hammer's high) before entering long.
- Indian example: Tata Motors showed a classic hammer on the 15-minute chart on 22 Jan 2024 at ₹480, followed by a green candle that closed above ₹490, triggering a quick intraday long that captured ~₹15 profit per share before resistance at ₹510.
3. Shooting Star & Hanging Man
- Shooting Star: Small real body near the low, long upper shadow, little or no lower shadow – bearish reversal after an uptrend.
- Hanging Man: Small real body near the low, long lower shadow – bearish reversal after an uptrend (less reliable than shooting star).
- Trading cue: Wait for a bearish confirmation candle (close below the low of the shooting star) before shorting.
- Indian example: Infosys formed a shooting star on the daily chart on 03 Apr 2024 near ₹1,580 after a rally from ₹1,460. The next day closed at ₹1,540, validating the bearish signal and leading to a 2-day decline to ₹1,500.
4. Spinning Top
- Appearance: Small real body with relatively equal upper and lower shadows.
- Interpretation: Indecision; often appears during consolidation or before a breakout.
- Trading cue: Use the spinning top as a warning to tighten stops or avoid new entries until a directional candle appears.
- Indian example: Nifty 50 displayed a spinning top on the weekly chart in late September 2023, hovering around 19,800. The index then broke above 20,000 the following week after a strong bullish engulfing.
5. Marubozu
- Appearance: No shadows (or very tiny ones); the real body spans the entire high-low range.
- Bullish Marubozu: Open = low, Close = high – strong buying pressure.
- Bearish Marubozu: Open = high, Close = low – strong selling pressure.
- Trading cue: A marubozu often signals the start of a sustained move; consider entering on the next candle in the same direction with a stop below the marubozu's low (for bullish) or above its high (for bearish).
- Indian example: On 08 Nov 2023, HDFC Bank printed a bullish marubozu on the 30-minute chart at ₹1,620 after a positive RBI policy hint. The stock continued upward, gaining ~₹80 over the next two sessions.
Key takeaway: Single-candle patterns are most reliable when they appear at significant technical zones (prior swing highs/lows, moving averages, Fibonacci retracements) and are accompanied by above-average volume. Use them as "alert" signals rather than standalone entry triggers.
Double Candlestick Patterns – Confirming the Shift
Double-candle patterns involve two consecutive candles and tend to be stronger reversal or continuation signals because they show a clear shift in sentiment from one period to the next.
1. Bullish & Bearish Engulfing
- Bullish Engulfing: A small bearish candle followed by a larger bullish candle that completely engulfs the prior candle's body.
- Bearish Engulfing: A small bullish candle followed by a larger bearish candle that engulfs the prior candle's body.
- Interpretation: The second candle overwhelms the first, indicating a shift in control.
- Trading cue: Enter on the close of the engulfing candle (or the next candle's open) with a stop beyond the opposite extreme of the pattern.
- Indian example: On the daily chart of Larsen & Toubro (L&T) on 15 Feb 2024, a bearish engulfing appeared at ₹2,250 after a short-term rally. The stock fell to ₹2,180 over the next three days, offering a short-selling opportunity with a stop above ₹2,300.
2. Harami (Bullish & Bearish)
- Bullish Harami: A large bearish candle followed by a small bullish candle wholly inside the prior candle's body.
- Bearish Harami: A large bullish candle followed by a small bearish candle inside the prior candle's body.
- Interpretation: The second candle shows hesitation; the prior momentum may be losing steam.
- Trading cue: Look for a confirmation candle in the direction of the harami's implication (bullish after bullish harami, bearish after bearish harami).
- Indian example: Axis Bank formed a bullish harami on the 4-hour chart on 02 Mar 2024 around ₹950 after a dip from ₹1,020. The subsequent candle closed above ₹970, confirming the bounce and leading to a rise toward ₹1,010 over the next week.
3. Tweezer Tops & Tweezer Bottoms
- Tweezer Top: Two (or more) candles with matching highs; the first is bullish, the second bearish.
- Tweezer Bottom: Two (or more) candles with matching lows; the first is bearish, the second bullish.
- Interpretation: The repeated failure to break a level signals strong resistance (top) or support (bottom).
- Trading cue: Treat the level as a potential reversal zone; wait for a candle that closes beyond the opposite side of the tweezers before acting.
- Indian example: In March 2024, the Nifty 50 formed a tweezer top at 22,350 on the daily chart (bullish candle on 07 Mar, bearish candle on 08 Mar both sharing the same high). The index subsequently slipped to 22,100, giving short-term traders a clear resistance level to respect.
4. Piercing Line & Dark Cloud Cover
- Piercing Line: A bearish candle followed by a bullish candle that opens below the prior low but closes more than halfway into the prior candle's body.
- Dark Cloud Cover: A bullish candle followed by a bearish candle that opens above the prior high but closes more than halfway into the prior candle's body.
- Interpretation: Partial reversal; the second candle shows a fight but not a complete takeover.
- Trading cue: Use these patterns as early warnings; wait for a stronger confirmation (e.g., engulfing or marubozu) before committing size.
- Indian example: On the 15-minute chart of Maruti Suzuki on 20 Jan 2024, a piercing line appeared near ₹9,200 after a dip from ₹9,500. The following candle closed above ₹9,300, validating the bounce and leading to a quick intraday gain of ~₹150.
Practical tip: Double patterns work best when they align with the prevailing trend's higher-timeframe bias. For instance, a bullish engulfing on a 15-minute chart is more trustworthy if the daily chart is already in an uptrend.
Triple Candlestick Patterns – Higher-Probability Setups
Triple-candle patterns combine three candles to form classic reversal or continuation formations. They are less frequent but often carry stronger statistical edge when validated with volume and support/resistance.
1. Morning Star & Evening Star
- Morning Star (bullish reversal):
- Long bearish candle.
- Small-bodied candle (can be Doji or spinning top) that gaps down or opens near the low of the first.
- Long bullish candle that closes well into the first candle's body.
- Evening Star (bearish reversal): mirror image – long bullish, small middle, long bearish.
- Interpretation: The middle candle shows indecision; the third candle confirms the shift in control.
- Trading cue: Enter on the close of the third candle (or next open) with a stop beyond the opposite extreme of the pattern.
- Indian example: On the daily chart of Sun Pharma, a morning star formed on 10 Apr 2024 around ₹1,080 after a decline from ₹1,200. The third bullish candle closed at ₹1,150, and the stock rallied to ₹1,260 over the next two weeks.
2. Three White Soldiers & Three Black Crows
- Three White Soldiers: Three consecutive long bullish candles, each opening within the prior candle's body and closing near its high.
- Three Black Crows: Three consecutive long bearish candles, each opening within the prior candle's body and closing near its low.
- Interpretation: Strong, sustained momentum in one direction.
- Trading cue: Consider adding to positions on pullbacks to the midpoint of the soldiers/crows, or use the pattern as a trend-confirmation signal.
- Indian example: In the Nifty 50 weekly chart from late October to early November 2023, three white soldiers appeared (weeks ending 28 Oct, 04 Nov, 11 Nov), each closing higher than the prior. The index climbed from 19,600 to 20,300, providing a clear trend-following opportunity.
3. Three Inside Up / Three Inside Down
- Three Inside Up:
- Long bearish candle.
- Bullish harami (small bullish inside the first).
- Bullish candle that closes above the high of the first candle.
- Three Inside Down: mirror image for bearish reversal.
- Interpretation: The harami shows a pause; the third candle confirms breakout from the prior range.
- Trading cue: Enter on the close of the third candle; place stop below the low of the first candle (for bullish) or above its high (for bearish).
- Indian example: Tata Steel displayed a three-inside-up on the 2-hour chart on 22 Feb 2024 around ₹130 after a dip from ₹150. The third candle closed at ₹138, and the stock subsequently moved to ₹145 over the next session.
4. Abandoned Baby (Bullish & Bearish)
- Bullish Abandoned Baby:
- Long bearish candle.
- Doji that gaps down (or opens below the low of the first).
- Long bullish candle that gaps up (opens above the high of the Doji).
- Bearish version is the inverse.
- Interpretation: The gaps indicate a sudden shift in sentiment; the pattern is considered a strong reversal signal.
- Trading cue: Enter after the third candle closes; use a stop beyond the opposite extreme of the pattern.
Downstox Markets Desk
Markets Desk · NSE · BSE · Nifty 50
Daily Indian-equities desk - Nifty, Sensex, sector wraps, technical analysis.
View Downstox Markets Desk's profile →Get weekly market insights delivered free
Curated Indian market analysis, every Sunday morning. Written by traders, for traders.
Join 10,000+ Indian traders. No spam. Unsubscribe anytime.
Related reads
More in technical analysis →
ZEEL Breakout Signal: Stock Radar Reveals 2026 Rebound Potential
8 Indian Stocks Crossing 200 DMA: Positive Breakout Signals 2026

HDFC AMC Shows Bullish Signals Hinting at Uptrend 2026

Nifty Bulls Target Critical 23,000‑23,100 Support Zone