UPL and Other Stocks Closing Above VWAP: Technical Analysis
Analyze why UPL and four other stocks closed above their VWAP today. Understand how volume-weighted average price signals potential momentum shifts in 2026.
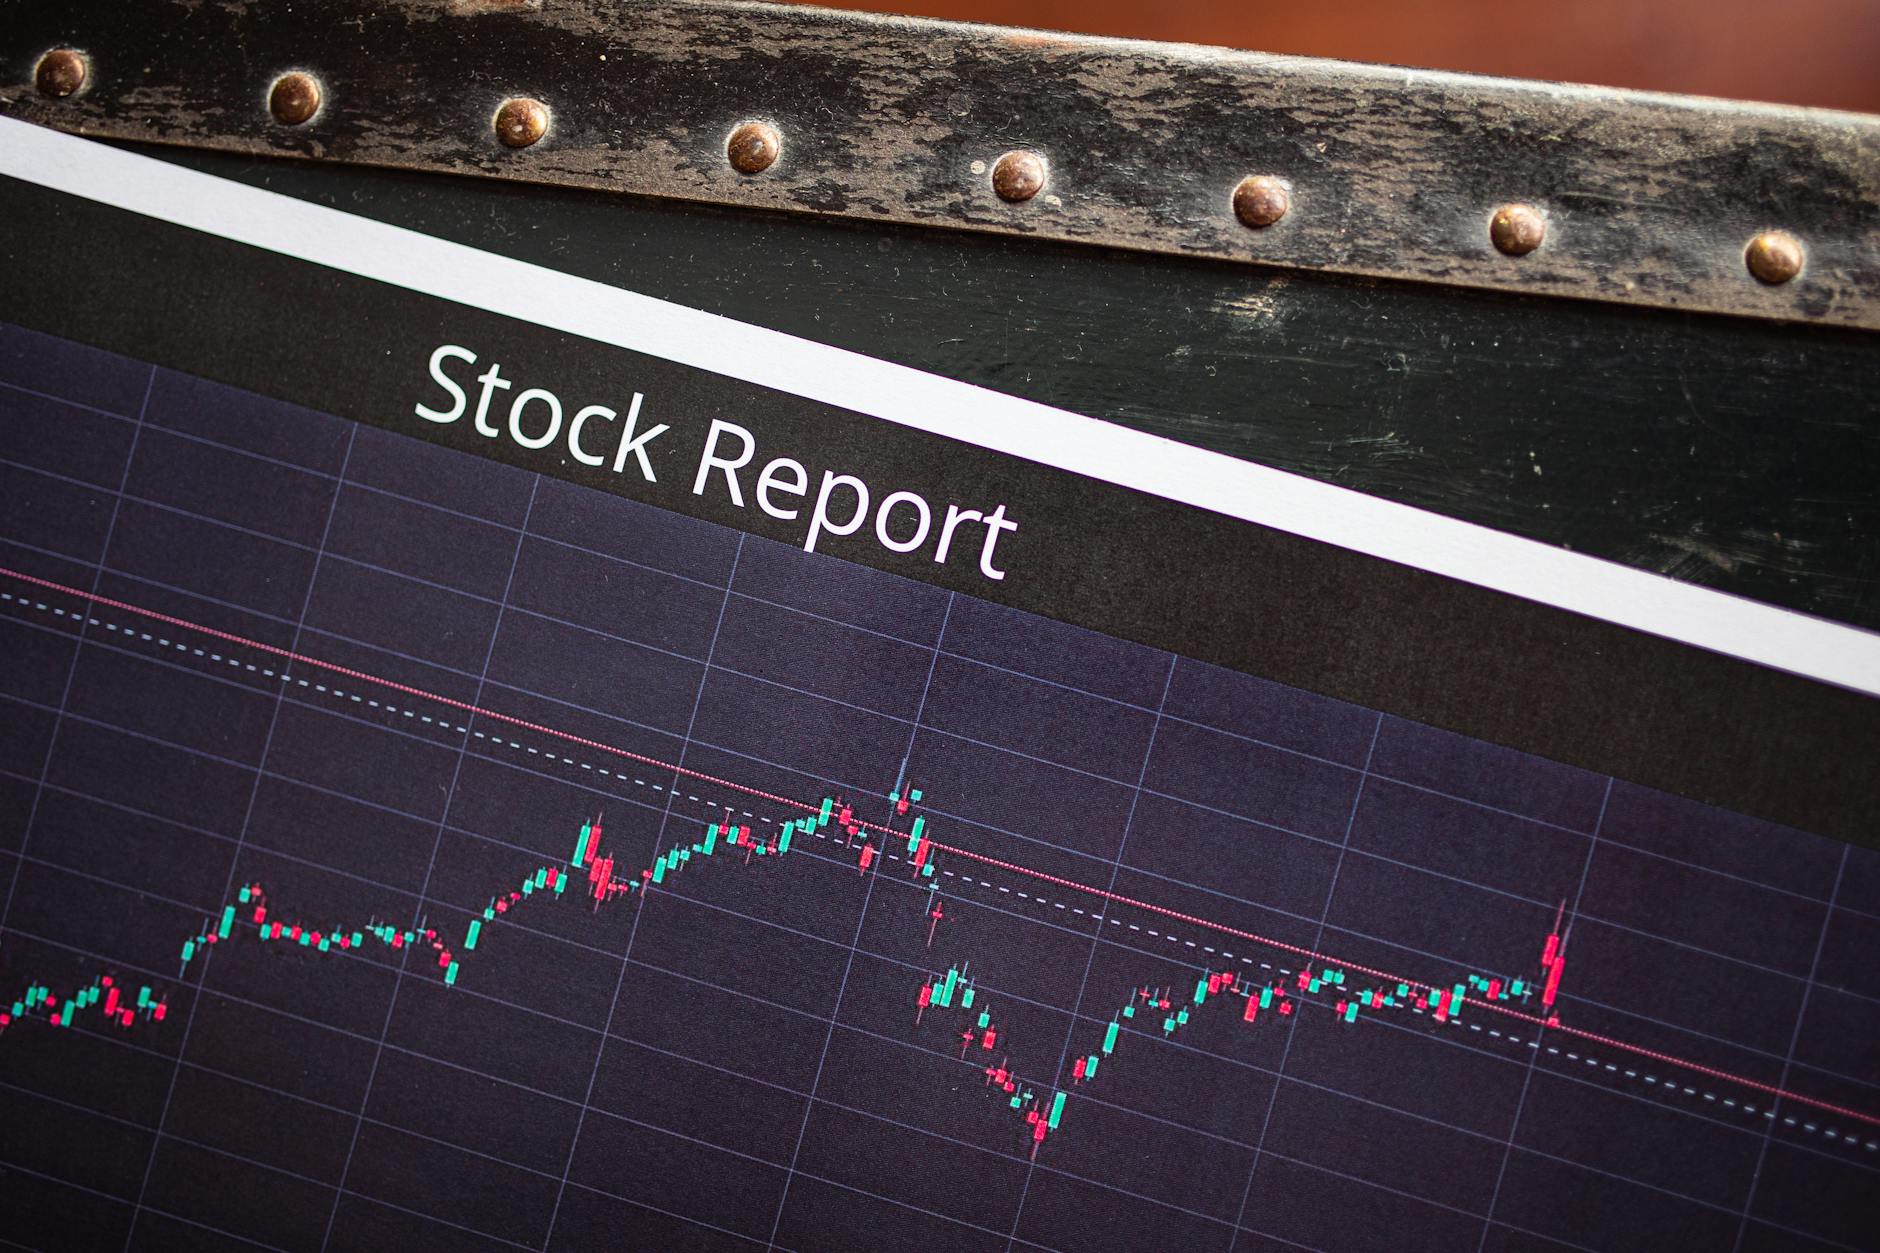
In the fast-paced world of intraday trading, technical indicators often act as the compass for navigating market volatility. For a trader looking at the National Stock Exchange (NSE) today, the Volume Weighted Average Price (VWAP) stands out as one of the most critical benchmarks. Unlike a simple moving average, which only considers time, VWAP incorporates both price and volume, providing a clearer picture of where the "true" average price of a stock lies during a single trading session.
When a stock closes significantly above its VWAP, it suggests that the buyers were aggressive enough to push the price higher than the average price paid by all market participants throughout the day. This often signals a potential shift in momentum. Today, market observers are closely watching UPL Limited, which, along with four other notable names, managed to close above their respective VWAP levels. For an investor or trader, understanding why this happens—and how to evaluate such signals—is key to building a disciplined trading strategy.
Understanding the Power of VWAP in Intraday Trading
To evaluate why a stock like UPL might show a bullish shift when closing above its VWAP, one must first understand the mechanics of this indicator.
What is VWAP?
VWAP (Volume Weighted Average Price) is a technical indicator used primarily by intraday traders to determine the benchmark price of a security. It is calculated by taking the total dollar value of all transactions for a security and dividing it by the total volume traded during that period.
Why does closing above VWAP matter?
When a stock closes above its VWAP, it indicates that the aggregate buying pressure outweighed the selling pressure throughout the session. In technical analysis terms:
- Bullish Signal: Closing above VWAP suggests that the stock has "strength" and that the intraday trend is upward.
- Institutional Footprint: Large institutional players often use VWAP to execute large orders without moving the market too much. If the price stays above VWAP, it suggests institutions are likely accumulating the stock.
- Support and Resistance: For many traders, the VWAP line acts as a dynamic support level during an uptrend.
However, it is vital to remember that a single day's close above VWAP is not a guarantee of future performance. It is a data point that helps in assessing the momentum of the current session.
Analyzing the Market Context: Why UPL?
When we look at a company like UPL Limited, a major player in the agrochemical sector, we cannot look at the chart in isolation. Technical signals like VWAP must be viewed alongside broader market trends and sector-specific news.
Sectoral Trends and Macro Factors
The agrochemical sector in India is highly sensitive to monsoon patterns, government subsidies, and global commodity prices (like phosphorus or nitrogen). If UPL is closing above its VWAP, an investor should ask:
- Is the Nifty Agrochemical Index trending upward?
- Are there positive monsoon updates from the IMD?
- Has there been a shift in global supply chain dynamics for fertilizers?
Using Tools to Filter Opportunities
Instead of manually scanning hundreds of stocks on the NSE, sophisticated traders often use tools like a stock screener to find stocks meeting specific criteria. For instance, you could set a filter for "Stocks where Close > VWAP and Volume > 20-day Average Volume." This helps narrow down the universe of stocks to those showing genuine liquidity and momentum.
How to Evaluate a "Bullish Shift" Without Guessing
A common mistake for novice traders is to jump into a stock simply because it crossed a certain line. To trade effectively, you need a structured framework for evaluation.
1. The Role of Volume Confirmation
A price move above VWAP is significantly more meaningful if it is accompanied by a spike in volume.
- High Volume + Above VWAP: This suggests high conviction from buyers.
- Low Volume + Above VWAP: This might be a "fake-out," where the price moves up due to a lack of sellers rather than strong buying interest.
2. Combining Indicators for Confluence
Never rely on a single indicator. To increase the probability of a successful setup, look for confluence—when multiple indicators agree.
- RSI (Relative Strength Index): Is the stock above VWAP but also "overbought" (RSI > 70)? If so, the move might be due for a correction.
- MACD (Moving Average Convergence Divergence): Is the MACD histogram turning positive alongside the VWAP crossover?
- Moving Averages: Is the stock also trading above its 50-day or 200-day EMA?
3. The Risk of the "Mean Reversion"
In trading, "mean reversion" is the theory that prices eventually return to their average. If a stock has moved too far above its VWAP too quickly, it is "extended." A smart trader uses the Downstox Terminal to monitor these price gaps to avoid buying at the absolute peak of a rally.
Practical Example: A Hypothetical Trading Scenario
Let's walk through how an investor might evaluate a setup like the one seen with UPL today.
Scenario:
- Stock: UPL Limited
- Current Price: ₹850
- VWAP Level: ₹840
- Condition: The stock closed at ₹850, which is above the VWAP of ₹840.
- Volume: Today's volume is 1.5x the average daily volume.
How to evaluate this:
- Check the Trend: Is the stock making higher highs and higher lows on a 15-minute chart?
- Check the Sector: Is the Nifty 50 or the sectoral index also showing green candles?
- Check the Risk: Where would the "stop loss" be? A common strategy is to place a stop loss just below the VWAP line or the previous swing low.
- Check the Reward: Is the potential upside (resistance level) significantly higher than the risk taken?
Cautionary Note: If the stock breaks below the VWAP, the bullish thesis is invalidated. This is why discipline in following a predefined exit strategy is more important than the entry itself.
Diversification and Risk Management for the Indian Investor
While identifying momentum stocks is exciting, the Indian market can be volatile due to global geopolitical shifts and domestic policy changes. A disciplined approach to portfolio management is essential.
Managing Your Portfolio
As you identify potential momentum stocks, you must ensure they don't represent too large a portion of your total capital.
- Portfolio X-Ray: Using tools like a Portfolio X-Ray can help you understand your exposure. For example, if you find yourself owning five different agrochemical stocks because they all closed above VWAP, your portfolio is highly concentrated in one sector. This increases your risk if that specific sector faces a downturn.
- Mutual Fund Screener: If you prefer a more passive approach, you can use a mutual fund screener to see if professional fund managers are increasing their allocation to sectors showing these bullish technical patterns.
The Importance of Position Sizing
Even if a stock shows a perfect VWAP crossover, you should never invest more than you can afford to lose. Position sizing—the amount of capital you allocate to a single trade—is the ultimate protector of your capital.
Conclusion: Moving from Observation to Analysis
Closing above the VWAP is a significant technical event that signals a potential shift in market sentiment. For a stock like UPL, this signal suggests that the bulls have taken control for the session. However, for an Indian investor, the true key to success lies in not treating these signals as "magic bullets," but as pieces of a larger puzzle.
To master this, one must combine technical analysis (VWAP, RSI, Volume) with fundamental awareness (Sectoral trends, Monsoon, Macroeconomics) and rigorous risk management (Stop-losses, Diversification). Instead of asking "Is this stock going up?", ask "What is the probability of this trend continuing, and what is my exit plan if it fails?"
By using advanced tools to screen for these patterns and maintaining a disciplined approach to portfolio construction, you can move from reactive trading to proactive, informed investing.
This article is for information and education only. Downstox is not a SEBI-registered Research Analyst or Investment Adviser and this is not investment advice. Markets carry risk; consult a SEBI-registered adviser before investing.
For information and education only. This article is for information and education only. Downstox is not a SEBI-registered Research Analyst or Investment Adviser, and nothing here is investment advice or a recommendation to buy or sell any security. Any views or calls attributed to third parties are theirs, not Downstox's. Markets carry risk; consult a SEBI-registered adviser before investing.
Downstox Markets Desk
Markets Desk · NSE · BSE · Nifty 50
Daily Indian-equities desk - Nifty, Sensex, sector wraps, technical analysis.
View Downstox Markets Desk's profile →Get weekly market insights delivered free
Curated Indian market analysis, every Sunday morning. Written by traders, for traders.
Join 10,000+ Indian traders. No spam. Unsubscribe anytime.
Related reads
More in technical analysis →
ZEEL Breakout Signal: Stock Radar Reveals 2026 Rebound Potential
8 Indian Stocks Crossing 200 DMA: Positive Breakout Signals 2026

HDFC AMC Shows Bullish Signals Hinting at Uptrend 2026

Nifty Bulls Target Critical 23,000‑23,100 Support Zone
