How to Start Investing in Indian Stock Market: A Complete Beginner Guide
Everything you need to know about start investing in indian stock market — practical strategies, key concepts, and tools for Indian investors and traders.

Investing in the Indian stock market can feel like stepping into a vast, bustling marketplace where countless opportunities coexist with risks. For someone who is just beginning, the sheer volume of information—indices, jargon, charts, regulations—can be overwhelming. Yet, the fundamentals remain the same: buying a share means owning a tiny slice of a company, and over time the value of that slice can rise or fall depending on the business's performance, macro-economic trends, and investor sentiment.
This guide walks through the essential steps a beginner in India might take to build a foundation for investing. It focuses on concepts, processes, and tools that are commonly used, without prescribing any specific action. The aim is to equip you with a framework for evaluating choices, understanding the mechanics of the market, and using available resources responsibly.
1. Understanding the Indian Stock Market Landscape
The Indian equity market is primarily served by two exchanges: the National Stock Exchange (NSE) and the Bombay Stock Exchange (BSE). Both platforms facilitate the electronic trading of shares, derivatives, and other securities. The NSE, launched in 1992, is known for its fully automated screen-based trading system, while the BSE, established in 1875, holds the distinction of being Asia's oldest stock exchange.
Regulatory oversight rests with the Securities and Exchange Board of India (SEBI). SEBI's mandate includes protecting investor interests, promoting fair and transparent markets, and regulating intermediaries such as brokers, depositories, and mutual funds. All listed companies must comply with SEBI's disclosure norms, which require periodic filing of financial results, shareholding patterns, and material events.
Two broad market-wide indices often serve as barometers: the Nifty 50 (representing 50 large-cap stocks on the NSE) and the S&P BSE Sensex (30 large-cap stocks on the BSE). Movements in these indices reflect aggregate investor sentiment and are frequently referenced in news reports, economic analyses, and policy discussions.
For a beginner, grasping the structure—exchanges, regulator, indices—helps contextualize where a particular stock sits, how its price is discovered, and what forces might influence its trajectory.
2. Setting Up Your Investment Infrastructure
Before you can place a trade, you need a few core accounts and documents:
- Permanent Account Number (PAN) – Mandatory for any financial transaction in India.
- Bank Account – Used to fund purchases and receive proceeds from sales.
- Demat Account – Holds your securities in electronic form. It is linked to a depository participant (DP) such as NSDL or CDSL.
- Trading Account – Interface through which you submit buy or sell orders to the exchange.
Most brokers offer a bundled Demat-trading account, simplifying the onboarding process. The Know-Your-Customer (KYC) procedure involves submitting identity and address proof (Aadhaar, passport, voter ID, etc.) along with a recent photograph. Once verified, you receive login credentials to access the broker's platform.
If you intend to invest in foreign securities (for example, US-listed stocks) under the Liberalised Remittance Scheme (LRS), you will need to open an overseas trading account with a broker that provides access to global exchanges. The LRS currently allows resident individuals to remit up to USD 250,000 per financial year for permissible current and capital account transactions, including overseas investments.
Understanding the cost structure is also part of setup. Brokers charge brokerage (a percentage of trade value or a flat fee), securities transaction tax (STT), exchange turnover charges, GST, and stamp duty. These costs vary across brokers and product types (equity delivery, intraday, futures, options). Reviewing the fee schedule before opening an account helps avoid surprises later.
3. Building Knowledge: Fundamental and Technical Analysis
Investors typically rely on two broad analytical approaches to evaluate securities:
Fundamental Analysis
This method seeks to estimate a company's intrinsic value by examining its financial health, business model, competitive position, and macro-economic environment. Key elements include:
- Financial Statements – Balance sheet, profit-and-loss account, and cash-flow statement. Ratios such as price-to-earnings (P/E), price-to-book (P/B), debt-to-equity, and return on equity (ROE) provide quick snapshots of valuation, leverage, and profitability.
- Earnings Growth – Consistent growth in net profit or operating profit can signal a sustainable business.
- Management Quality – Track record, corporate governance practices, and transparency in disclosures.
- Industry Dynamics – Demand trends, regulatory landscape, and competitive pressures.
For example, to assess a consumer-goods company listed on the NSE, an investor might look at its revenue growth over the past five years, examine gross margin trends, and compare its P/E ratio with sector peers.
Technical Analysis
This approach focuses on historical price and volume patterns to forecast future movements. Tools include:
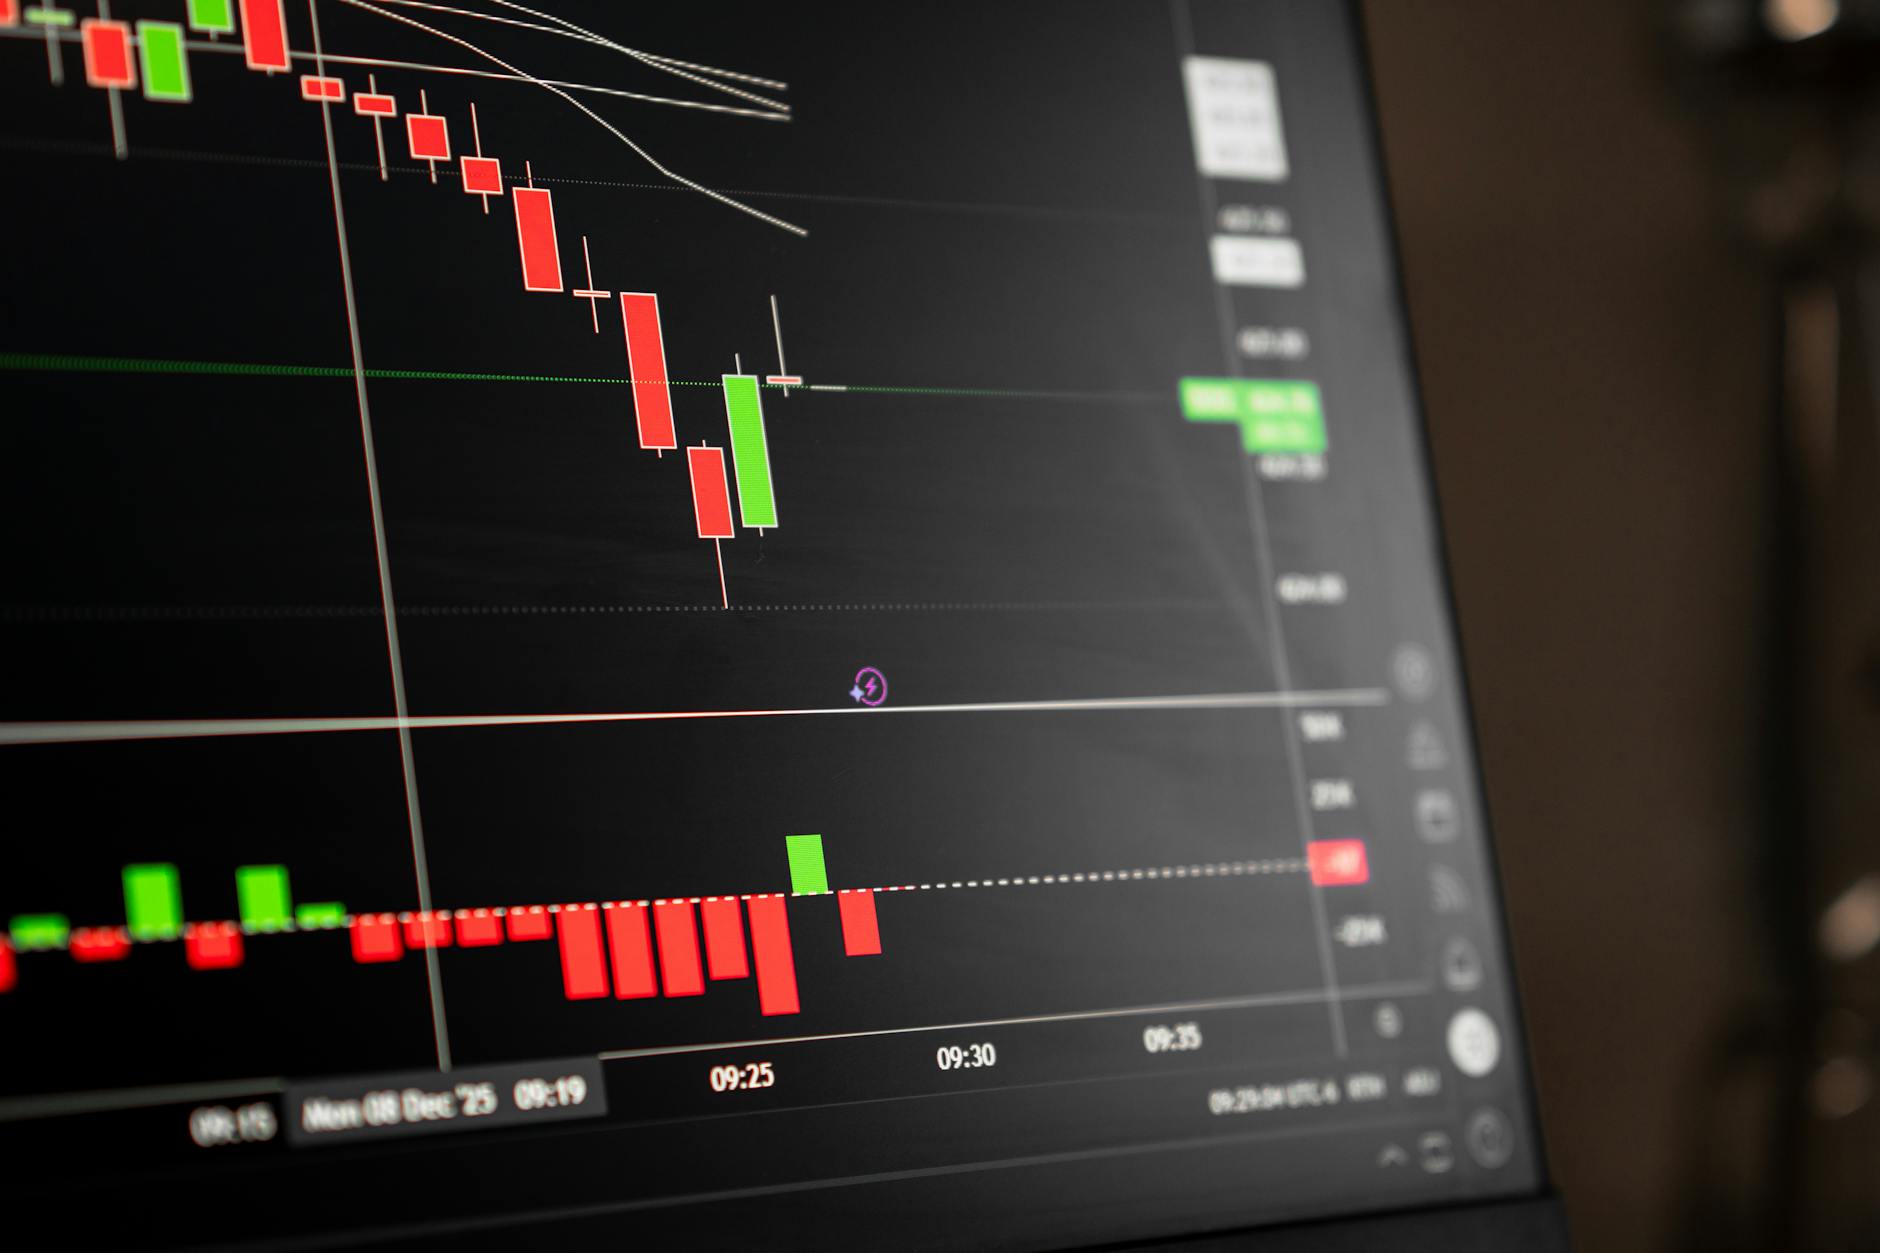
- Price Charts – Line, bar, and candlestick charts displayed across various timeframes (intraday, daily, weekly).
- Indicators – Moving averages, Relative Strength Index (RSI), Moving Average Convergence Divergence (MACD), Bollinger Bands, etc.
- Chart Patterns – Head-and-shoulders, double tops/bottoms, triangles, flags.
Technical analysts believe that market psychology often leaves recognizable traces in price action. A beginner might start by learning how to read a simple candlestick chart and identify support and resistance levels before experimenting with indicators.
Both approaches have strengths and limitations. Fundamental analysis tends to be more relevant for long-term horizon investing, while technical analysis can aid short-term timing decisions. Many investors blend elements of both, using fundamentals to select candidates and technicals to fine-tune entry or exit points.
4. Creating an Investment Plan
A disciplined plan helps align actions with personal circumstances and goals. Consider the following components:
Define Objectives
Ask yourself what you are investing for—wealth creation over a decade, funding a child's education, buying a house, or building a retirement corpus. Objectives influence the investment horizon, risk tolerance, and asset allocation.
Assess Risk Tolerance
Risk tolerance reflects how much volatility you can endure without deviating from your plan. Factors include age, income stability, financial responsibilities, and psychological comfort with market swings. A younger investor with a steady income might tolerate higher equity exposure, while someone nearing a major financial goal may prefer a more conservative mix.
Determine Asset Allocation
Asset allocation is the distribution of capital across broad categories such as equities, fixed income, gold, and cash. Historical data shows that diversification across uncorrelated assets can reduce portfolio volatility. A common starting point for a moderate-risk investor might be 60 % equities, 30 % debt, and 10 % gold or alternatives, but the exact split should reflect personal circumstances.
Choose Investment Vehicles
Within equities, you can opt for direct stock purchases, exchange-traded funds (ETFs), index funds, or actively managed mutual funds. Each vehicle carries different cost structures, liquidity profiles, and levels of involvement. For instance, an index fund that replicates the Nifty 50 offers broad market exposure with low expense ratios, whereas picking individual stocks requires deeper research and monitoring.
Systematic vs. Lump-Sum Investing
A Systematic Investment Plan (SIP) involves investing a fixed amount at regular intervals (e.g., monthly). This approach can average out purchase costs over time and instill discipline. Lump-sum investing deploys the entire amount at once, which may be suitable when you have a large corpus and a clear view of market valuations. Both methods have merits; the choice often hinges on cash flow availability and market outlook.
Set Review Intervals
Markets evolve, and so do personal circumstances. Scheduling periodic reviews—quarterly, semi-annually, or annually—allows you to check whether your portfolio remains aligned with the original plan, rebalance if allocations have drifted significantly, and incorporate any new goals or constraints.
5. Using Tools for Research and Screening
Modern brokerage platforms provide a suite of digital tools that can streamline the research process. Below are examples of how such features might be used, illustrated with generic functionalities that resemble those offered by Downstox (the mention is purely illustrative and not an endorsement).
Stock Screener
A screener lets you filter the universe of listed stocks based on quantitative criteria. For example, you could set parameters such as:
- Market capitalization > ₹5,000 crore (to focus on larger companies)
- P/E ratio between 10 and 25 (to avoid extremely high or low valuations)
- Return on equity (ROE) > 15 % (to target efficiently managed firms)
- Debt-to-equity < 0.5 (to limit leverage)
The screener returns a list of stocks meeting all conditions, which you can then examine further using fundamental reports or news feeds. This process helps narrow down candidates without manually scanning thousands of tickers.
Trading Terminal
A terminal typically offers real-time quotes, advanced charting, order-entry windows, and market depth. Features such as customizable watchlists, alerts for price movements, and the ability to place various order types (market, limit, stop-loss) enable active monitoring and execution. For a beginner, starting with a simple layout—watchlist of a few stocks of interest, a basic chart with moving averages, and a limit order window—can reduce complexity while still providing essential functionality.
Portfolio X-Ray
After you have built a portfolio, an X-ray tool analyses its composition across dimensions such as sector exposure, market-cap breakdown, geographic diversification (if you hold international assets), and factor tilts (value, growth, dividend yield). By visualizing these metrics, you can spot concentrations that may increase risk—for instance, an overweight position in a single sector—and consider adjustments to achieve a more balanced profile.
Mutual Fund Screener
If you prefer the mutual fund route, a screener can filter funds based on criteria like fund category (large-cap, flexi-cap, hybrid), expense ratio, historical returns (e.g., 3-year CAGR), risk ratings (standard deviation, Sharpe ratio), and fund manager tenure. This helps you compare options side-by-side and assess whether a fund's strategy matches your investment plan.
When using any tool, remember that the output is a starting point, not a verdict. Quantitative filters can miss qualitative factors such as management changes, upcoming regulatory shifts, or macro-economic shocks. Complement screeners with reading annual reports, listening to earnings calls, and staying updated on relevant news.
6. Executing Your First Trade and Monitoring Your Portfolio
Placing an Order
Once you have identified a security and decided on the quantity, you submit an order through your trading account. Common order types include:
- Market Order – Executes immediately at the prevailing best price. Simple but offers no price control.
- Limit Order – Specifies the maximum price you are willing to pay (for a buy) or the minimum price you will accept (for a sell). The order executes only if the market reaches your limit.
- Stop-Loss Order – Designed to limit potential loss; becomes a market order once the stock hits a predefined trigger price.
Understanding the implications of each type helps you manage execution risk. For example, in a highly volatile stock, a market order might result in a price significantly different from the last quoted price due to rapid movements.
Charges and Taxes
Every trade incurs costs beyond the brokerage fee. In India, equity delivery trades attract:
- Securities Transaction Tax (STT) – 0.1 % of the transaction value for both buy and sell sides.
- Exchange Turnover Charges – A small percentage levied by NSE/BSE.
- Goods and Services Tax (GST) – Applied on brokerage and transaction charges.
- Stamp Duty – Varies by state; typically 0.005 % on the buy side for delivery trades.
For intraday trades, STT is only on the sell side (0.025 % of sell value). Additionally, profits from equity holdings are subject to capital gains tax: short-term gains (holding period < 12 months) taxed at 15 %, long-term gains (holding period ≥ 12 months) taxed at 10 % above an exemption limit of ₹1 lakh per financial year. Being aware of these levies ensures that your net returns reflect the true cost of trading.
Monitoring and Review
After a trade is executed, the holding appears in your Demat account. Regular monitoring involves:
- Price Tracking – Observing how the stock moves relative to your purchase price and any target or stop levels you set.
- News and Events – Keeping an eye on quarterly results, management commentary, macro-economic announcements, and sector-specific developments.
- Portfolio Metrics – Checking overall portfolio value, asset allocation drift, and performance benchmarks (e.g., Nifty 50 returns).
If a stock's fundamentals deteriorate significantly or if the portfolio's risk profile deviates from your plan, you may consider rebalancing—selling a portion of overweight holdings and reinvesting in underweight areas or cash. Rebalancing decisions should be guided by your plan, not by short-term market noise.
Conclusion
Starting to invest in the Indian stock market is a process that blends knowledge, preparation, and disciplined execution. By understanding how exchanges and regulators operate, setting up the necessary accounts, building analytical skills, crafting a personalized investment plan, leveraging research tools, and executing trades with an awareness of costs and taxes, you create a foundation that can evolve with your experience and changing goals.
Remember that investing is not a one-time activity but an ongoing journey of learning and adaptation. Markets will fluctuate, new information will emerge, and personal circumstances will shift. Periodic reviews, a clear focus on your objectives, and a willingness to refine your approach based on evidence—not emotion—are key habits that can help navigate the uncertainties inherent in equity participation.
This article is for information and education only. Downstox is not a SEBI-registered Research Analyst or Investment Adviser and this is not investment advice. Markets carry risk; consult a SEBI-registered adviser before investing.
For information and education only. This article is for information and education only. Downstox is not a SEBI-registered Research Analyst or Investment Adviser, and nothing here is investment advice or a recommendation to buy or sell any security. Any views or calls attributed to third parties are theirs, not Downstox's. Markets carry risk; consult a SEBI-registered adviser before investing.
Downstox Markets Desk
Markets Desk · NSE · BSE · Nifty 50
Daily Indian-equities desk - Nifty, Sensex, sector wraps, technical analysis.
View Downstox Markets Desk's profile →Get weekly market insights delivered free
Curated Indian market analysis, every Sunday morning. Written by traders, for traders.
Join 10,000+ Indian traders. No spam. Unsubscribe anytime.
Related reads
More in technical analysis →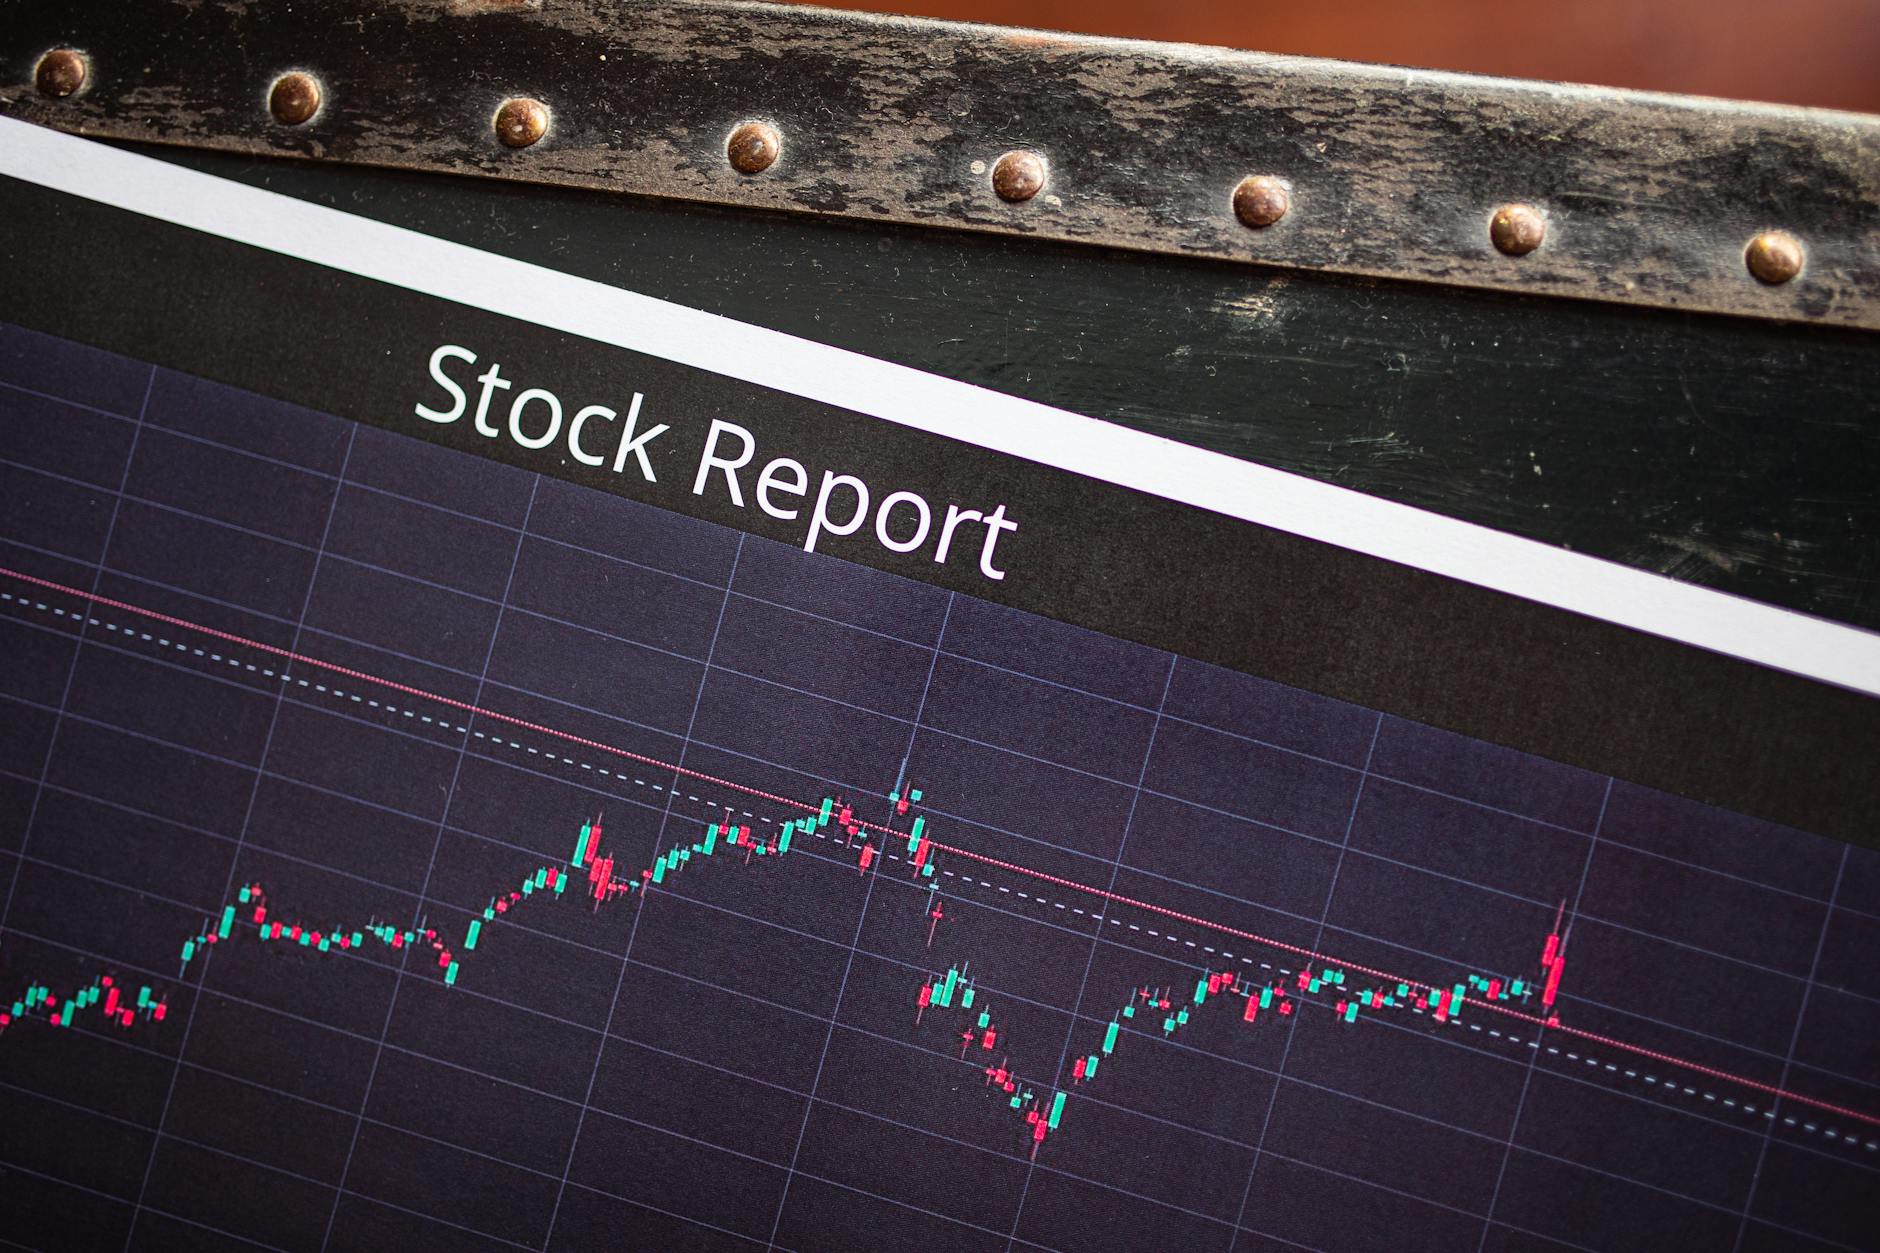
UPL and Other Stocks Closing Above VWAP: Technical Analysis

ZEEL Breakout Signal: Stock Radar Reveals 2026 Rebound Potential
8 Indian Stocks Crossing 200 DMA: Positive Breakout Signals 2026

HDFC AMC Shows Bullish Signals Hinting at Uptrend 2026

Nifty Bulls Target Critical 23,000‑23,100 Support Zone
