Analyzing Short-Term Momentum in Bharat Forge and Other Stocks
Explore the technical setup behind Jigar Patel's recent observations on Bharat Forge and other stocks for momentum trading in August 2026.
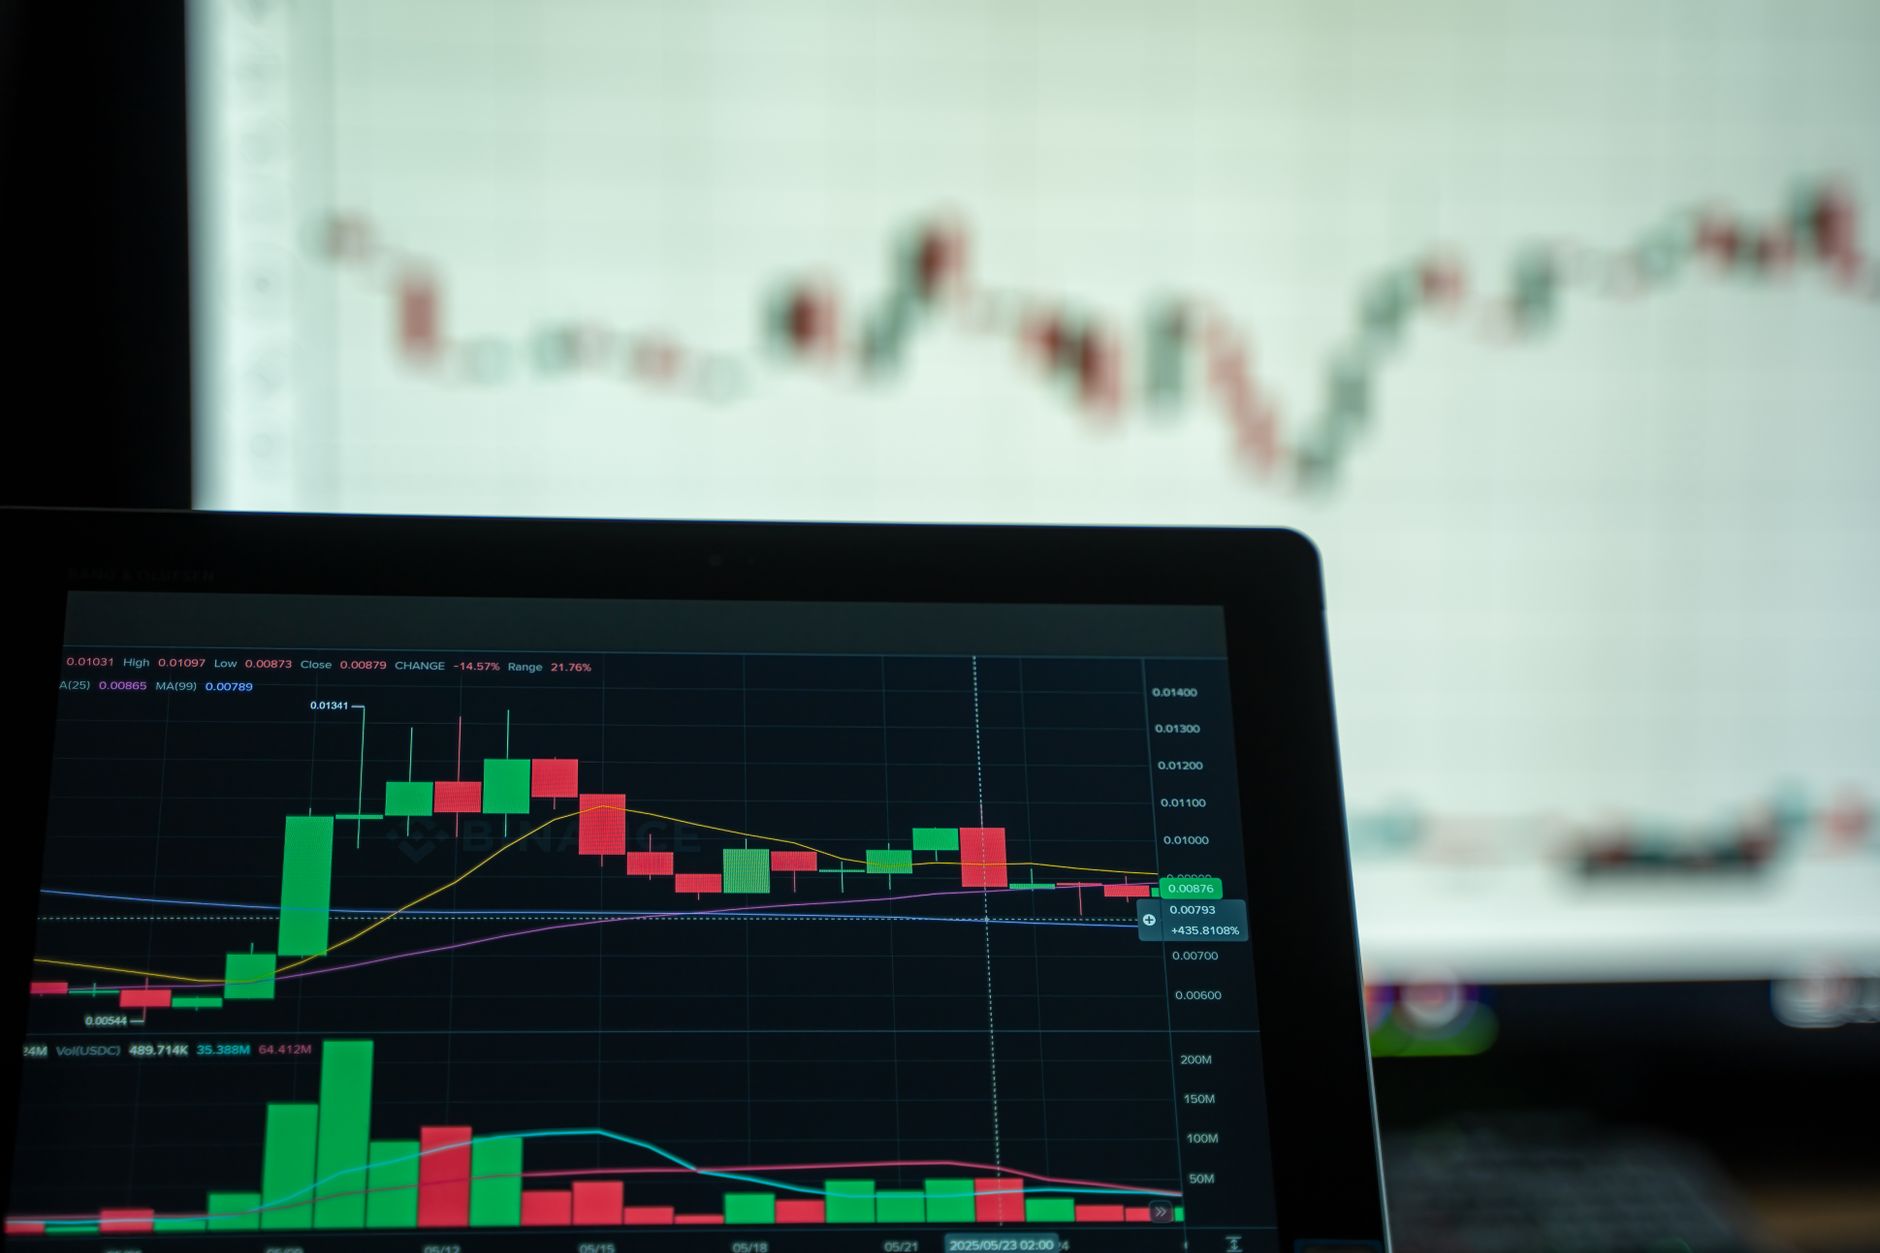
Navigating the volatility of the Indian equity markets requires a keen eye on short-term momentum and technical setups. For traders operating on a 1-2 week horizon, the goal is often to identify stocks showing significant strength in terms of volume and price action, rather than long-term fundamental shifts. As we move through August 2026, market participants are closely watching sector rotations and breakout patterns that could define the direction of the Nifty 50 and Sensex in the coming weeks.
When trading in such tight timeframes, relying on a single indicator is rarely effective. Instead, successful traders often look for a confluence of factors: volume spikes, moving average crossovers, and institutional sentiment. This article explores how to evaluate short-term momentum plays, specifically looking at the recent market observations shared by industry experts regarding specific industrial and financial names.
Understanding Short-Term Momentum Trading
Short-term trading, often referred to as swing trading or momentum trading, involves capturing price movements over a period ranging from a few days to a couple of weeks. Unlike long-term investing, where you might focus on a company's five-year growth trajectory, short-term trading is about price action and liquidity.
The Role of Technical Indicators
To evaluate if a stock is poised for a short-term move, traders often utilize several key tools:
- Relative Strength Index (RSI): This helps identify if a stock is "overbought" (above 70) or "oversold" (below 30). For momentum traders, an RSI trending upwards from the 50 level often signals growing strength.
- Moving Averages: The 20-day and 50-day Exponential Moving Averages (EMA) are frequently used to identify the immediate trend. A "golden crossover" on a shorter timeframe can indicate a potential entry point.
- Volume Analysis: Price movement without volume is often considered a "false breakout." High trading volume during a price rise suggests that institutional players are participating in the move.
Managing Risk in Volatile Windows
Because short-term trades are sensitive to news cycles and sudden market shifts, risk management is paramount. Traders often use a "Stop-Loss" order to automatically exit a position if the price moves against them by a predetermined percentage. This prevents a small setback from turning into a significant capital erosion.
Analyzing Expert Views: The Case of Bharat Forge
In recent market discussions, market analysts have been highlighting specific setups in the engineering and industrial sectors. As reported by various financial news outlets, Jigar Patel of Anand Rathi has identified certain stocks showing potential for short-term movement over the next 1-2 weeks. Among these, Bharat Forge has been frequently cited as a stock to watch.
Why Industrial Stocks Gain Momentum
Bharat Forge, a leader in the forging and automotive components space, often reacts to shifts in global manufacturing demand and domestic infrastructure spending. When evaluating such a stock for a short-term trade, one should consider:
- Order Book Strength: A sudden influx of large orders in the defense or aerospace segments can act as a catalyst for price movement.
- Sectoral Tailwinds: If the Nifty Auto or Nifty Industrial index is showing strength, individual stocks within those sectors often follow suit.
- Technical Breakouts: Traders look for instances where the stock price breaks above a significant "resistance" level on high volume.
When evaluating a stock like Bharat Forge, it is essential to use a screener to see if the stock is outperforming its sectoral peers. If the stock is rising while the broader Nifty index is sideways, it indicates "relative strength," a key component for short-term momentum.
Evaluating the Financial and Diversified Plays
Beyond industrial stocks, short-term traders often pivot toward the financial sector, as it carries high weightage in the Nifty 50 and often drives market direction. In the context of the recommendations discussed by analysts like Jigar Patel, the focus often shifts to how liquidity is flowing into specific segments of the economy.
How to Evaluate Financial Stocks for Short-Term Moves
Financial stocks are highly sensitive to interest rate sentiments and credit growth data. To evaluate a financial stock for a 1-2 week horizon, consider these parameters:
- Institutional Activity (FII/DII): In the Indian market, the activity of Foreign Institutional Investors (FIIs) and Domestic Institutional Investors (DIIs) can dictate short-term trends. A surge in FII buying in a specific banking stock can trigger momentum.
- Price-to-Book (P/B) Ratio Trends: While P/B is a fundamental metric, sudden shifts in how the market values a bank's assets can lead to rapid price corrections or rallies.
- Volatility (Beta): For short-term traders, a higher Beta (a measure of volatility relative to the market) can be beneficial, as it implies the stock moves more aggressively than the index, offering larger potential gains (and risks) in a short window.
For investors looking to manage a variety of such plays, using a Portfolio X-Ray tool can be helpful to ensure that a short-term trading strategy isn't accidentally creating over-exposure to a single sector, such as having too much capital tied up in only industrial or only financial stocks.
The Strategy: How to Evaluate Potential "Breakout" Stocks
If you are looking to identify your own short-term opportunities, rather than following specific calls, you need a systematic way to filter the thousands of listed stocks on the NSE and BSE.
Step 1: Identify the Trend
Start by looking at the broader market. Is the Nifty 50 making "higher highs" and "higher lows"? It is much easier to trade momentum when the tide is rising. If the market is in a downtrend, even the strongest individual stocks may struggle to sustain a breakout.
Step 2: Use a Screener for Specific Criteria
Instead of browsing manually, use a stock screener to filter for specific momentum triggers. For example, you might set filters for:
- Price > 50-day Moving Average.
- Volume > 1.5x the 20-day average volume.
- RSI between 60 and 70 (indicating strong momentum but not yet extreme overbought levels).
Step 3: Confirm with Candlestick Patterns
A breakout is more reliable when accompanied by specific candlestick patterns. For example, a "Bullish Engulfing" pattern or a "Marubozu" candle (a long candle with little to no shadows) at a resistance level can signal that buyers have taken control.
Step 4: Plan the Exit Before the Entry
This is the most critical step in short-term trading. Before you place a trade, you must know:
- Your Entry Point: At what price does the breakout become "confirmed"?
- Your Target: Where is the next major resistance level where you will take profits?
- Your Stop-Loss: At what price is your thesis proven wrong?
Navigating Market Risks and Volatility
While short-term trading can offer quick opportunities, it is inherently higher risk than long-term investing. In 2026, as global markets remain interconnected, a sudden geopolitical event or a shift in US Federal Reserve policy can cause immediate volatility in Indian markets.
Common Pitfalls to Avoid
- Chasing the Rally: Buying a stock after it has already moved up 10-15% in a few days is a recipe for being caught in a "pullback." It is often better to wait for a slight retracement to a moving average.
- Over-leveraging: Using too much margin to increase your position size can lead to catastrophic losses if the market moves against you, even if your direction was correct.
- Ignoring News: Even a technically perfect chart can be invalidated by a sudden regulatory announcement from SEBI or unexpected corporate earnings reports.
Utilizing Advanced Trading Tools
To stay ahead, traders often use a professional trading terminal that provides real-time data and advanced charting capabilities. These tools allow you to overlay multiple indicators and monitor multiple timeframes (e.g., checking the daily chart for the trend and the 15-minute chart for the entry) simultaneously.
Conclusion: A Systematic Approach to Short-Term Trading
Identifying potential momentum plays, such as the ones discussed by analysts regarding Bharat Forge and other stocks, is only the first step. The real skill lies in the ability to objectively evaluate these suggestions through the lens of technical analysis and rigorous risk management.
Whether you are looking at industrial leaders or financial powerhouses, always remember that short-term trading is a game of probabilities, not certainties. Use tools like screeners to find candidates, confirm them with volume and candlestick patterns, and always protect your capital with disciplined stop-losses.
By combining expert market insights with a structured, data-driven approach, you can navigate the complexities of the Indian stock market with greater confidence.
This article is for information and education only. Downstox is not a SEBI-registered Research Analyst or Investment Adviser and this is not investment advice. Markets carry risk; consult a SEBI-registered adviser before investing.
For information and education only. This article is for information and education only. Downstox is not a SEBI-registered Research Analyst or Investment Adviser, and nothing here is investment advice or a recommendation to buy or sell any security. Any views or calls attributed to third parties are theirs, not Downstox's. Markets carry risk; consult a SEBI-registered adviser before investing.
Downstox Sectors Desk
Sectors & Stocks Desk · Sector analysis · Stock fundamentals · Tata group
Sector-level reporting (IT, pharma, auto, defence) and individual stock coverage.
View Downstox Sectors Desk's profile →Get weekly market insights delivered free
Curated Indian market analysis, every Sunday morning. Written by traders, for traders.
Join 10,000+ Indian traders. No spam. Unsubscribe anytime.
Related reads
More in trading strategies →
How To Use Dollar-Cost Averaging In US Stocks: A 2026 Guide

As the U.S.-Iran war heats up again, these parts of the stock market and economy could be affected

HDFC Bank Q1 Results: Net profit rises 5% YoY to Rs 19,060 crore, NII up 7%

Tensions with Iran add fresh uncertainty to an already shaky global economy

RBI tightens governance framework, redefines bank board responsibilities
