Swing Trading Outlook for Indian Equity Markets: August 2026
Analyze the Nifty 50 and Sensex volatility for mid-August 2026. Learn how macroeconomic shifts and sector breakouts impact swing trading strategies.
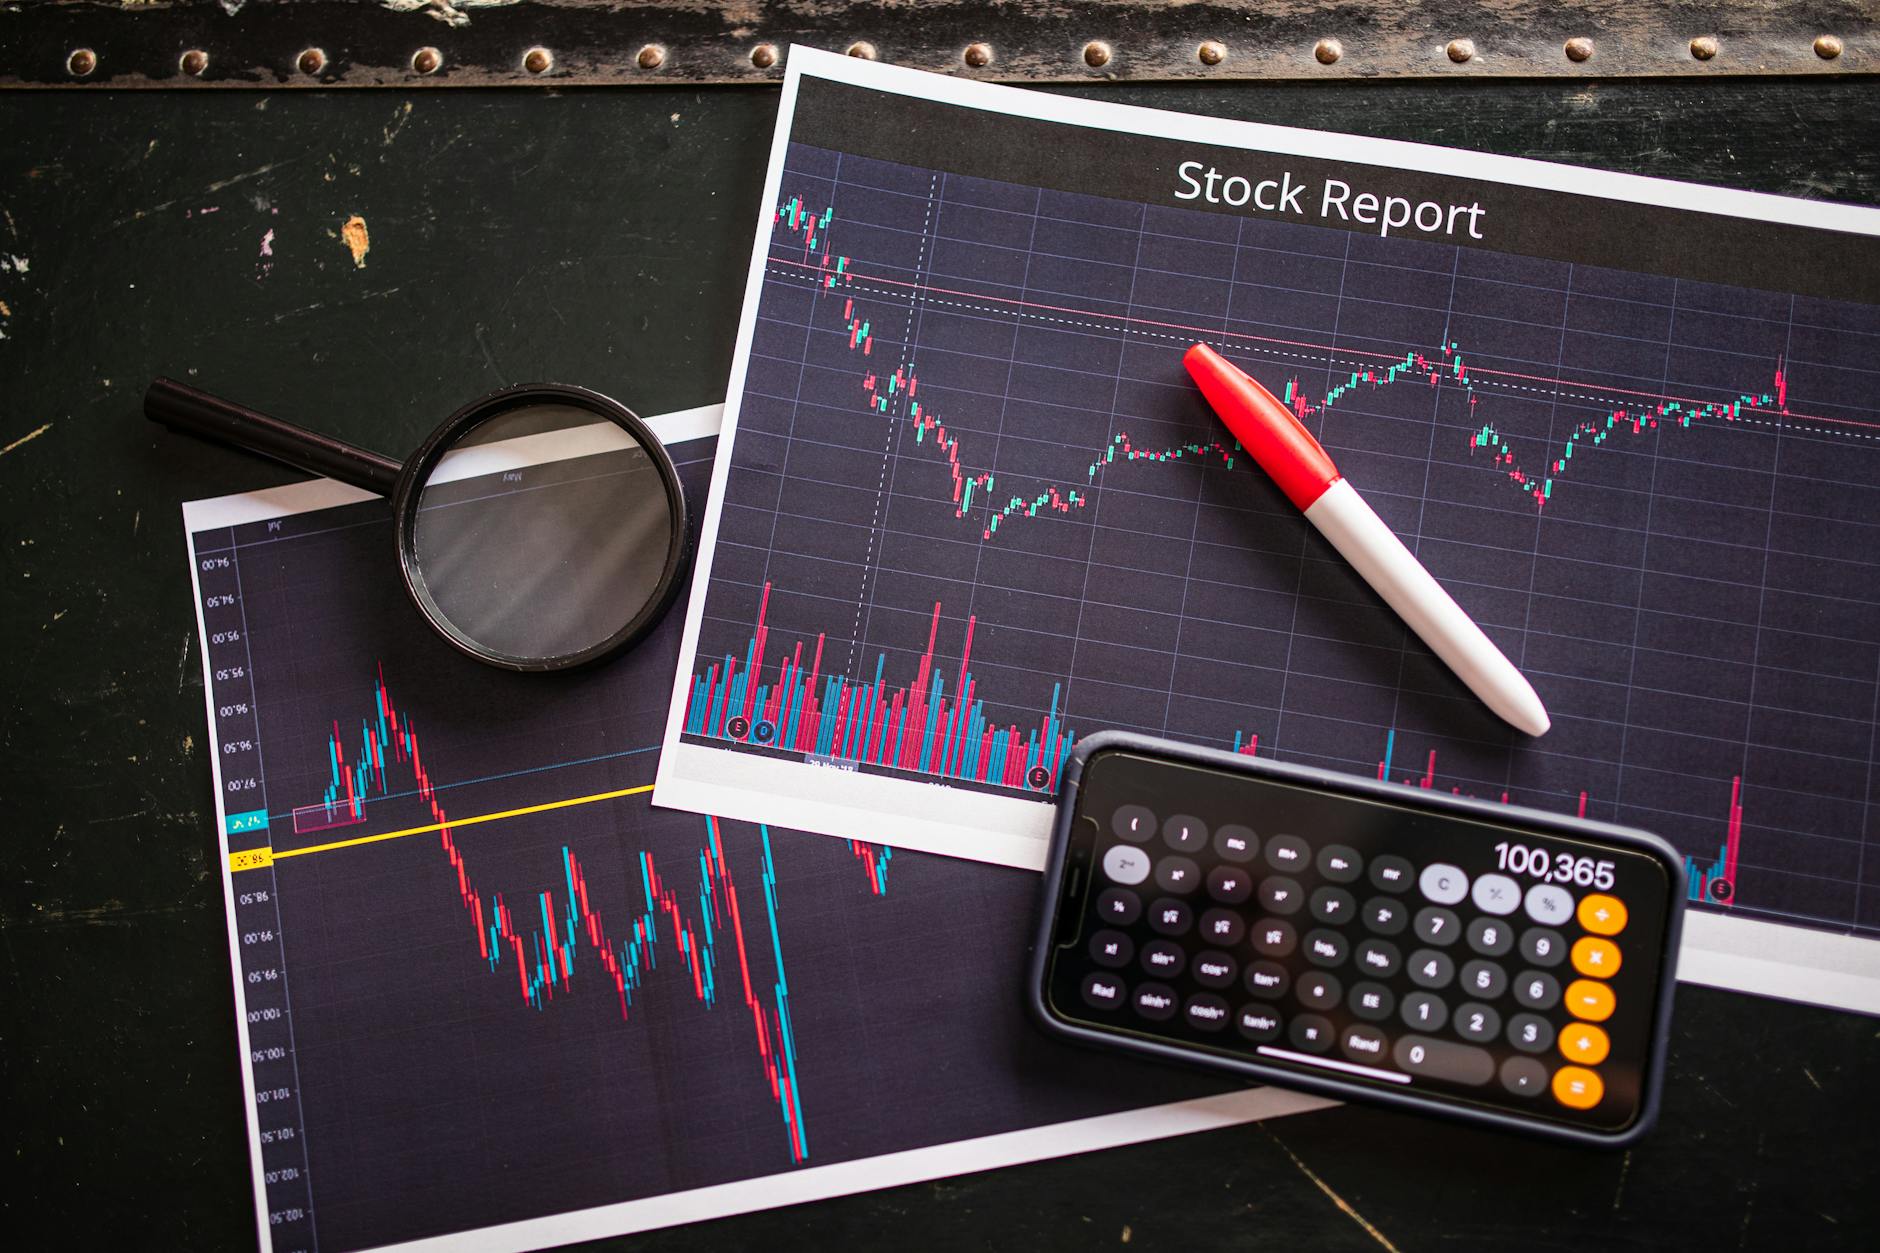
As we move into the third week of August 2026, the Indian equity markets are exhibiting a fascinating interplay of volatility and momentum. For the swing trader—the investor looking to capture price movements over a period of days to a few weeks—this environment requires a disciplined approach to technical setups and a keen eye on macroeconomic shifts.
The Nifty 50 and Sensex have been navigating a complex landscape this month, influenced by shifting global liquidity patterns and domestic corporate earnings cycles. For those utilizing tools like the Downstox Terminal to track real-time movements, the current market structure suggests that while broad-based rallies may be intermittent, specific sectors are showing signs of structural breakouts.
Understanding the Macro Backdrop for Swing Trading
To trade effectively in 2026, one must first understand the "why" behind the price action. Swing trading is not just about spotting a green candle; it is about identifying where the tide is turning.
Domestic Economic Indicators
The Reserve Bank of India (RBI) has maintained a cautious stance regarding inflation, which has kept the interest rate environment relatively stable but sensitive. For a swing trader, this means monitoring the yield curve and liquidity in the banking system. When liquidity is high, mid-cap and small-cap stocks often see rapid, short-lived bursts of momentum—perfect for swing setups. Conversely, in a tightening liquidity regime, large-cap stocks on the NSE tend to be more resilient.
Global Market Interconnectivity
Even as an Indian investor, the ripples from the NYSE and Nasdaq are felt locally. Global sentiment, driven by US Federal Reserve decisions and geopolitical developments, often dictates the "opening gap" in our domestic markets. A trader should always check how US tech stocks performed overnight, as this often sets the tone for the Indian IT sector during the morning session.
How to Evaluate Market Sentiment
Instead of guessing the direction, professional traders often look at:
- VIX (Volatility Index): High VIX suggests higher potential for large swings, but also higher risk.
- FII/DII Activity: Tracking whether Foreign Institutional Investors are net buyers or sellers provides a clue to the underlying trend.
- Sectoral Rotation: Money often flows from Defensive sectors (like FMCG) to Cyclical sectors (like Auto or Metal) depending on the economic cycle.
Technical Frameworks for Identifying Swing Setups
Swing trading relies heavily on the marriage of Price Action and Volume. Since we are looking at a timeframe of days to weeks, daily and weekly charts are your primary tools.
The Power of Moving Averages
One of the most reliable ways to evaluate a trend is through Moving Averages (MA).
- The Golden Cross/Death Cross: While these are long-term signals, observing how a stock reacts when the 50-day EMA (Exponential Moving Average) crosses the 200-day EMA can provide significant momentum signals.
- Mean Reversion: If a stock has moved too far away from its 20-day MA, it is likely to "revert to the mean." For a swing trader, this might mean waiting for a pullback to the average before looking for an entry.
Support and Resistance Zones
A "breakout" is only as good as the volume that accompanies it. When a stock clears a multi-month resistance level on high volume, it often enters a "markup phase."
- Example: If a stock has been oscillating between ₹500 and ₹550 for three months, a decisive close above ₹555 with a spike in volume might indicate a new swing leg upward.
Using the Downstox Screener for Discovery
Manually scanning hundreds of stocks on the NSE is impossible. This is where a Screener becomes indispensable. To find swing candidates, you might set parameters such as:
- RSI (Relative Strength Index): Looking for stocks where the RSI is moving from 40 to 60 (indicating emerging momentum).
- Volume Spikes: Stocks where today's volume is >2x the 10-day average volume.
- Price Proximity to 50-day EMA: Looking for stocks that have just "touched" their 50-day EMA and are bouncing back.
Sectoral Analysis: Where is the Momentum Shifting?
In 2026, we are seeing a significant shift in capital allocation. Understanding which sectors are "in favor" can save a trader from fighting the market trend.
Banking and Financial Services (BFSI)
As credit growth remains a key focus for the Indian economy, the banking sector remains a heavyweight. When Nifty Bank shows strength, it often leads the broader Nifty 50. Traders should look for "cup and handle" or "flag" patterns in leading private sector banks.
Manufacturing and Infrastructure
With the continued emphasis on "Make in India" and infrastructure spending, the industrial and capital goods sectors have shown periodic bursts of volatility. These stocks often move in "cycles"—they stay quiet for months and then move 20-30% in a few weeks.
The Tech and Digital Transformation
The IT sector, heavily influenced by US market sentiment (Nasdaq), remains a staple for swing traders. However, the focus has shifted from pure services to AI-integrated solutions. Monitoring the performance of large-cap IT stocks can provide a hedge or a way to capture momentum during global tech rallies.
Managing Risk via Portfolio X-Ray
A common mistake for swing traders is over-concentration. If you have three different stocks in the same sector (e.g., three different Auto stocks), you aren't diversified; you are triple-leveraged to one sector. Using a tool like Portfolio X-Ray allows you to see your sectoral exposure, ensuring that a single sector downturn doesn't wipe out your weekly gains.
Practical Implementation: A Step-by-Step Example
Let's walk through how a trader might evaluate a hypothetical setup for this week.
Scenario: The "Pullback to Support" Strategy
- Identification: You notice Company X (a large-cap manufacturing firm) has been in an uptrend for the last month.
- The Trigger: The stock price has dropped from ₹1,200 to ₹1,150 over the last three trading sessions.
- Evaluation: You check the chart and see that ₹1,150 aligns perfectly with the 50-day EMA and a previous resistance-turned-support level.
- Confirmation: You look at the volume. The selling volume is decreasing, suggesting the "selling pressure" is drying up.
- Execution (Hypothetical Example):
- Entry: Near ₹1,155 (once a bullish candle forms).
- Stop-Loss: A strict exit if the stock closes below ₹1,130 (to protect capital).
- Target: The previous swing high of ₹1,210.
Risk Management Rules:
- Never trade without a Stop-Loss: In swing trading, you are looking for high probability, but no probability is 100%.
- Position Sizing: Never allocate your entire capital to a single swing trade. A common rule is to never risk more than 1-2% of your total capital on a single trade's stop-loss.
- The 2:1 Ratio: Aim for trades where the potential profit (reward) is at least twice the potential loss (risk).
Navigating Volatility: Psychological Discipline
The biggest enemy of a swing trader in 2026 is not the market, but their own emotions. When a trade goes against you, the urge to "average down" (buying more as the price falls) is immense.
Avoiding the "Averaging Down" Trap
Averaging down is a strategy for long-term investors with high conviction in a company's fundamentals. For a swing trader, it is a recipe for disaster. If your technical thesis is broken (i.e., the stock hit your stop-loss), the trade is over. Accept the small loss and move to the next setup.
The Importance of Patience
Sometimes, the best trade is no trade. If the Nifty 50 is stuck in a "sideways" or "choppy" range, the probability of hitting a stop-loss increases significantly. Use this time to research, use your Mutual Fund Screener to understand broader trends, and wait for a clear directional signal.
Keeping a Trading Journal
Every successful trader keeps a log. Note down:
- Why you entered the trade.
- What the technical setup was.
- How you felt during the trade (were you anxious? greedy?).
- The outcome.
By reviewing your journal, you will start to see patterns in your own behavior, allowing you to refine your strategy for the coming months.
Conclusion
The outlook for the upcoming week suggests a market characterized by selective participation. While the broad indices may show cautious movement, specific pockets of momentum are likely to emerge in sectors benefiting from domestic industrial growth and shifting global sentiment.
For the disciplined swing trader, the key lies in combining technical indicators (like moving averages and RSI) with a rigorous risk management framework. By using modern tools to filter the noise and focusing on high-probability setups, you can navigate the volatility of the 2026 markets with greater confidence. Remember, swing trading is a game of probabilities, not certainties. Focus on the process, manage your risks, and let the trends work in your favor.
This article is for information and education only. Downstox is not a SEBI-registered Research Analyst or Investment Adviser and this is not investment advice. Markets carry risk; consult a SEBI-registered adviser before investing.
For information and education only. This article is for information and education only. Downstox is not a SEBI-registered Research Analyst or Investment Adviser, and nothing here is investment advice or a recommendation to buy or sell any security. Any views or calls attributed to third parties are theirs, not Downstox's. Markets carry risk; consult a SEBI-registered adviser before investing.
Downstox Macro Desk
Macro & Policy Desk · RBI monetary policy · Indian fiscal policy · GST
RBI, Centre policy, FX, FII flows, global macro spillover into Indian markets.
View Downstox Macro Desk's profile →Get weekly market insights delivered free
Curated Indian market analysis, every Sunday morning. Written by traders, for traders.
Join 10,000+ Indian traders. No spam. Unsubscribe anytime.
Related reads
More in market analysis →Can AI Predict Market Timing? Analyzing Recent Study Findings 2026

Technocraft Ventures IPO Day 2: Subscription Status and GMP

Why Indian Markets Rise Amid Global Uncertainty in 2026

Natural Gas Price Trends 2026: Analyzing Geopolitical Impact